In 1999, a Base Set booster box retailed for about $116. The shadowless 1st Edition print of that same box lists for $15,000 in today's market — a 19.7% compound annual return sustained over 27 years, through two market crashes, a pandemic bubble, and a correction. The S&P 500 returned roughly 8% annually over the same window. But the box is not even the headline: the most instructive returns in this hobby came from places almost nobody was looking, and the data shows the same three patterns repeating across every era.
Fame is not the alpha — print-window scarcity is
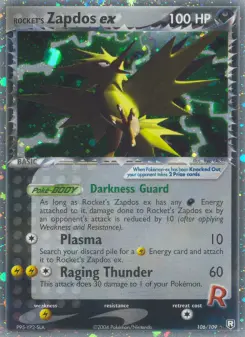
Ask a casual collector to name the best Pokémon investment and they will say Charizard. The sale data disagrees in an interesting way. In current PSA 10 medians, the cards commanding $5,000–$7,500 are dominated not by Base Set icons but by the 2002–2007 scarcity window: e-Series sets printed at the franchise's commercial low point (Aquapolis, Skyridge) and the EX-era Gold Stars and Delta Species chases that followed. An Aquapolis Kingdra — a card most collectors have never held — carries a PSA 10 median of $7,544. Metagross Gold Star trades at $7,425 in PSA 9. Salamence ex from Dragon Frontiers: $7,225 in PSA 10, on all of four recorded sales.
The scarcity-window cohort
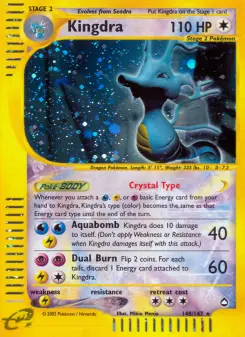
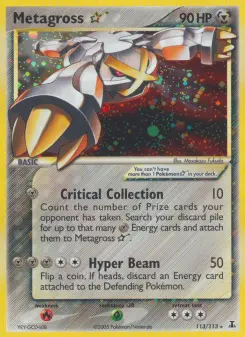

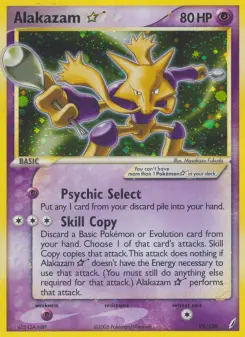
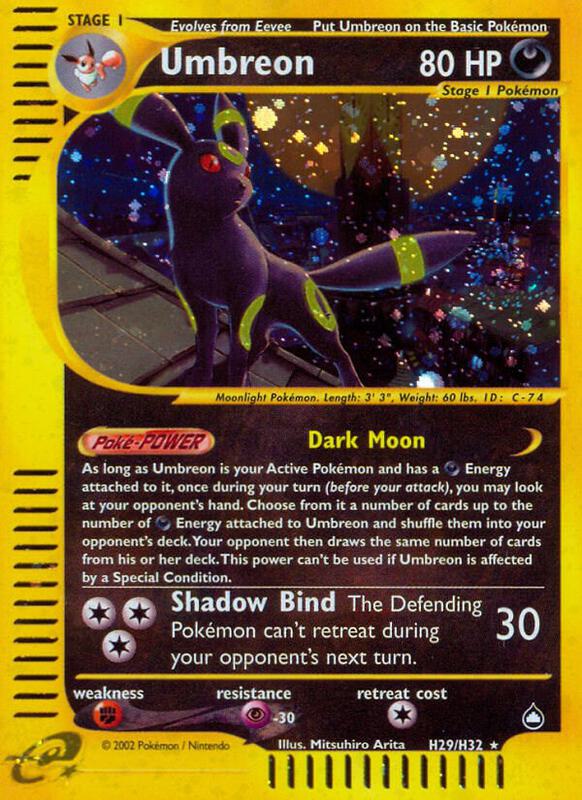
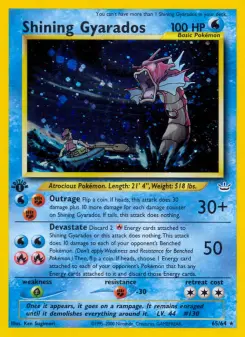
The mechanism is supply, not demand. These sets were printed when the franchise was commercially cold — 2002–2003 sell-through was a fraction of 1999's — and graded populations reflect it. Demand recovered; supply never can. The identical mechanism is visible today wherever a print window closes early, which is why the pattern matters more than the specific cards: the next Aquapolis is whatever nobody is opening right now.
The gem ceiling: one grade point is the whole trade
Across every era in our sample, the spread between a PSA 9 and a PSA 10 of the same card is the single largest return lever in the hobby — and it scales with how hard the card is to grade. XY Evolutions Charizard, a card printed in enormous quantity in 2016, shows a 10.3× multiple ($680 in PSA 9 against $6,999 in PSA 10) purely because its holo surface grades gem so rarely. Modern products with better quality control compress the multiple to 2–2.5×. This is condition leverage: the underlying card is identical; the entire spread is certification scarcity.
PSA 10 price as a multiple of PSA 9 — same card, same market
Sealed product is the index fund — and it out-compounded the market
Single cards are stock-picking. A sealed booster box is the index: it holds every chase card in the set at expected-value weighting, cannot be down-graded, and gets scarcer every time someone opens one. The listed market for sealed boxes in our data tells a remarkably consistent story across three decades — double-digit compounding for every era that survived to scarcity, with the steepest curves belonging to modern sets whose print windows closed while demand was peaking.
From retail to today — the sealed compounding curves
The sealed cohort, priced today
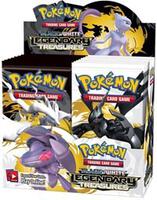
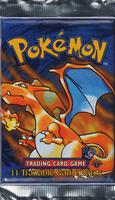


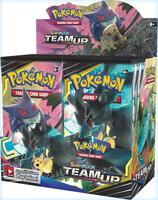
Retail baselines: 36-pack booster boxes at $3.24 MSRP per pack for WotC-era product (~$116/box); $130 street for 2013 product; six-box cases at contemporary street pricing ($540 in 2016, $864 in 2021). Current values are Moonstone sealed market listings as of the publication date — listing prices, not confirmed sales, and sealed markets are thin; treat the modern CAGRs as indicative of trajectory, not executable returns at size. S&P 500 comparison uses total-return CAGR ≈8% for 1999–2026 on an equal starting stake.
The liquidity revolution nobody prices in
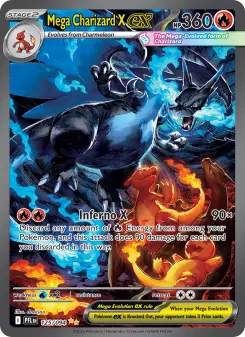
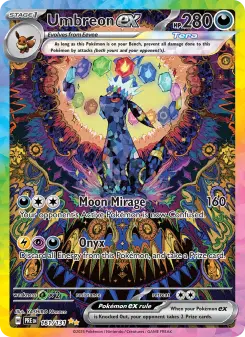
The most under-discussed shift of the past five years is not price — it is depth. Our sale-sample counts make it stark: era rarities set their medians on 3–7 recorded sales, art-market conditions where a single motivated buyer moves the print. A 2025 chase card settles its median on hundreds to over a thousand recorded sales in the same window. Modern graded Pokémon has become a liquid market with tight spreads and instant exits; vintage remains an appraisal market. Neither is wrong — but they are different asset classes wearing the same sleeve, and position sizing should treat them that way.
Market depth — recorded PSA 10 sales behind each median
Two markets, one hobby

What thirty years actually taught
The playbook, compressed
| Signal | What the data showed | The forward application |
|---|---|---|
| Print-window scarcity | 2002–07 low-print sets out-price Base Set icons in gem grades | Track sell-through cold spots, not hype peaks |
| Condition leverage | 3–10× PSA 9→10 spreads on hard-to-grade surfaces | Buy gradeable raw copies where the 10-multiple is widest |
| Sealed as index | Every surviving era compounded 19–80% annually from retail | EV-weighted exposure without single-card risk |
| Liquidity tiering | Modern medians settle on 100–1,500 sales; vintage on 3–7 | Size vintage like art; trade modern like equities |
| Grade-population drift | High-pop modern compresses gem premiums to ~2.5× | The multiple, not the price, is the early signal |
None of this is a promise about the next thirty years. It is a record of the last thirty: scarcity created by inattention, leverage hidden in condition, indexes disguised as unopened boxes, and a liquidity structure that quietly split the hobby into two different asset classes. Every product referenced in this article links to its live Moonstone page — the same data this analysis was built from, updating daily.
Graded figures are median recorded sale prices with stated sample sizes from Moonstone graded market data as of July 2026; entries with grade-inverted medians on samples under eight sales were excluded as data-quality artifacts rather than smoothed. Card and sealed links resolve to live Moonstone pages whose prices update continuously and may differ from the figures captured here. Nothing in this article is financial advice; collectibles are illiquid, volatile, and can lose value.