Every price chart on this site is a line that mostly goes up, because the last eighteen months mostly went up. That is the wrong way to read risk. The question a holder actually faces is how far a card falls from the best price it ever showed them, how long it stays down, and whether it comes back. We have 2,417 cards with a continuous recorded price curve reaching back to January 2025, across 40 sets, so we computed the drawdown of every one of them: the deepest peak-to-trough fall in the window, where the card sits against its high today, and what happened after the falls that hurt. Momentum and the summer dip are questions about direction. This is a question about pain, and it has a different answer for a $2 card than a $200 one.
A 22% fall is the middle of the distribution, not a crash
Drawdown here means the largest fall from any earlier high in the card's own recorded curve, measured on our TCGplayer market price series from late January 2025 to this week (median span 593 days; weekly cadence for most of the window, daily since late July 2026 apart from a gap in the second half of August). Across all 2,417 curves the median deepest drawdown was 22.6%. A quarter of cards never fell more than 11.6%; a quarter fell 33.6% or worse; 788 cards, one in three, fell at least 30%, and 191 fell at least 50%. Nobody experiences the median, so the shape matters more than the centre: the distribution is wide and flat rather than peaked, which is another way of saying that a card's own history tells you little about how far it can fall.
Deepest drawdown since January 2025, cards priced $5 and up
Restrict the book to cards priced $5 or more today and the picture softens: median deepest drawdown 15.0%, quartiles 7.3% and 25.2%, 210 cards (16.5%) past 30% and 41 (3.2%) past 50%. Part of that is real (expensive cards are more liquid and their prices move on more sales) and part of it is selection: a card that fell hard and stayed down is more likely to be priced under $5 now. The next section fixes that by sorting on the price a card started at rather than the price it ended at.
The cheap cards fell hardest and rose least
Drawdown and return by starting price (median of the first ten recorded points, January 2025)
| Start price | Cards | Median deepest drawdown | Fell 30%+ | Median gain to today | Within 5% of high now |
|---|---|---|---|---|---|
| Under $1 | 716 | 32.2% | 407 (56.8%) | +67.0% | 220 (30.7%) |
| $1 to $5 | 784 | 23.2% | 239 (30.5%) | +79.3% | 338 (43.1%) |
| $5 to $25 | 620 | 14.9% | 101 (16.3%) | +86.9% | 380 (61.3%) |
| $25 to $100 | 230 | 10.0% | 31 (13.5%) | +94.9% | 168 (73.0%) |
| $100 and up | 67 | 12.3% | 10 (14.9%) | +57.5% | 50 (74.6%) |
Sorted by where a card started, the pattern holds without the selection problem. Cards that began the window under $1 had a median deepest drawdown of 32.2%, and 57% of them fell at least 30%; cards that began between $25 and $100 had a median deepest drawdown of 10.0%, and 13.5% fell 30%. The cheap tier also gained the least, +67.0% at the median against +94.9% for the $25 to $100 tier. Only the $100-and-up tier breaks the line, with a smaller +57.5% median gain on 67 cards; those are the chase cards, and one reading is that their 2025 run front-loaded the gains. Volatility at the bottom of the price list is not a reward for risk. Much of it is likely thin-market noise: a 50-cent card can move 30% when one seller reprices, and the series cannot tell that from a repricing.
Sword & Shield cards drew down twice as deep as Sun & Moon
Drawdown and return by era (cards with a full curve; WotC and Scarlet & Violet have no curves long enough to rate)
| Era | Cards | Median deepest drawdown | Fell 30%+ | Median gain to today | Within 5% of high now | Median distance from high now |
|---|---|---|---|---|---|---|
| Sun & Moon (2017 to 2019) | 1,226 | 15.5% | 198 (16.2%) | +95.2% | 772 (63.0%) | 2.6% |
| Sword & Shield (2020 to 2022) | 745 | 30.6% | 387 (51.9%) | +50.9% | 185 (24.8%) | 11.6% |
| XY (2014 to 2016) | 138 | 24.5% | 53 (38.4%) | +68.0% | 41 (29.7%) | 8.6% |
| Other (promos, McDonald's, subsets) | 254 | 34.8% | 142 (55.9%) | +95.0% | 116 (45.7%) | 7.1% |
| Black & White | 29 | 15.8% | 6 | +137.8% | 20 | 2.4% |
| EX era | 25 | 12.8% | 2 | +132.4% | 22 | 1.0% |
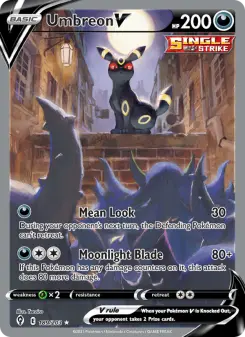
The era split is the finding we did not expect. Sun & Moon cards, five to eight years old, had a median deepest drawdown of 15.5% and a median gain of +95.2%; Sword & Shield cards, three to five years old, drew down 30.6% at the median and gained +50.9%. Half of the Sword & Shield book fell 30% or more at some point, and it is the era furthest from its highs today: a median 11.6% below, with only a quarter of cards within 5% of their peak. Evolving Skies is in that book. So is Umbreon V, which printed $687.88 in late September 2025 and sits at $390.25, 43% below, 349 days later. A set that was the market's centre of gravity in 2025 has spent 2026 giving some of it back while the older era kept compounding.
Four cards in five set their high since June
Month in which each $5+ card set its 18-month high
The single most important line in this piece is a date. Of the 1,269 cards priced $5 and up, 486 set their 18-month high in the first thirteen days of September 2026, and 1,004 set it since June. Today 814 of them (64.1%) sit within 5% of that high, 170 sit 5% to 10% below, 177 sit 10% to 20% below, and only 44 are more than 30% below. Read one way, that is a market with almost no drawdown to speak of. Read the other way, it is a market in which the drawdown has not happened yet for most of the book, and every risk number above was measured in the most forgiving eighteen months the hobby has had. Our own ledger is marked against the same tape, and it looks good for the same reason.
Buying after a 30% fall beat nothing
The strategy everyone believes in is the one we can test directly. For each of the 1,269 cards priced $5 and up we found the first day, if any, on which the card had fallen 30% from its running high, and measured what happened next. There were 210 such episodes. Ninety days after the 30% line was crossed the median card was up 5.9% and 124 of 198 (62.6%) were higher than on the day they crossed it. That sounds like a win until it is set against the unconditional: across every 90-day window in the same cards, sampled every 30 days (20,340 windows), the median return was +9.7% and 76.4% were positive. The card that had just fallen 30% did worse over the next quarter than a card picked at random from the same book on a random day.
After the first 30% drawdown, cards priced $5 and up (210 episodes)
| Group | Episodes | Median 90-day return | Positive at 90 days | Median 180-day return | Positive at 180 days | Regained 95% of prior high | Median days to regain |
|---|---|---|---|---|---|---|---|
| All $5+ | 210 | +5.9% | 124 of 198 (62.6%) | +24.6% | 152 of 183 (83.1%) | 132 (62.9%) | 140 |
| $5 to $25 now | 149 | +7.9% | 89 of 138 (64.5%) | +29.3% | 109 of 129 (84.5%) | 100 (67.1%) | 140 |
| $25 to $100 now | 44 | +1.1% | 24 of 43 (55.8%) | +19.1% | 30 of 39 (76.9%) | 21 (47.7%) | 140 |
| $100 and up now | 17 | +6.9% | 11 of 17 | +21.5% | 13 of 15 | 11 | 133 |
| Unconditional, any 90-day window | 20,340 | +9.7% | 76.4% | n/a | n/a | n/a | n/a |
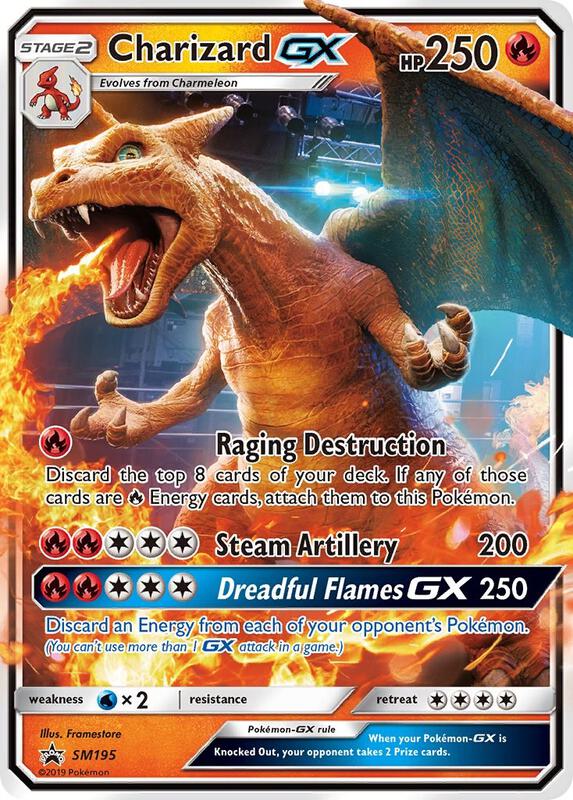
Stretch the horizon to 180 days and the dip buyer is fine: median +24.6%, 83% positive, and 132 of the 210 episodes (62.9%) eventually climbed back to within 5% of the prior high, a median 140 days after crossing the 30% line. But the 180-day unconditional return in a market that rose this much is also large, and the recovery rate is a statement about the market, not about the dip. The median episode bottomed 37.4% below its peak, a further 7 points after the 30% trigger, and 31 of 210 went past 50%. The honest summary is that a 30% fall in this window carried no positive information: it did not predict a bounce, it predicted a quarter of mild underperformance, and it did not predict a further collapse beyond what any card did either. Falls that were real repricings (the Charizard GX promo below) did not come back; falls that were noise did, and nothing in the price series separated them at the time.
Where the book is furthest under water
Deepest current drawdowns among cards that reached $25 or more (price is the median of the last ten recorded points)
| Card | Set | 18-month high | Now | Below high | Days since high |
|---|---|---|---|---|---|
| Charizard GX | SM Black Star Promos SM195 | $103.38 | $24.87 | 75.9% | 356 |
| Nest Ball | Sun & Moon 158 | $27.32 | $9.20 | 66.3% | 594 |
| M Charizard EX | Evolutions 13 | $106.98 | $42.52 | 60.3% | 363 |
| Pikachu & Zekrom GX | Team Up 33 | $127.86 | $56.36 | 55.9% | 97 |
| Umbreon V | Evolving Skies 189 | $687.88 | $390.25 | 43.3% | 349 |
| Field Blower | Guardians Rising 163 | $32.26 | $18.32 | 43.2% | 384 |
| Umbreon GX | Sun & Moon 142 | $97.93 | $57.66 | 41.1% | 517 |
| Lillie | Sun & Moon 147 | $73.73 | $43.76 | 40.6% | 538 |
| Escape Rope | Burning Shadows 163 | $27.57 | $16.71 | 39.4% | 510 |
| Blacephalon GX | Lost Thunder 219 | $55.15 | $33.98 | 38.4% | 363 |
| M Altaria EX | Fates Collide 121 | $41.08 | $25.76 | 37.3% | 489 |
| Kyogre-EX | Dark Explorers 104 | $500.00 | $317.72 | 36.5% | 475 |
| Celesteela GX | Ultra Prism 162 | $43.03 | $27.49 | 36.1% | 251 |
| Darkness Energy | Evolving Skies 236 | $38.20 | $24.44 | 36.0% | 125 |
Two kinds of hole. The first is the secret-rare trainer and energy: Nest Ball, Field Blower, Escape Rope, Darkness Energy, cards whose 2025 prices rode a general lift. The plausible reading is that their buyers were players who stopped needing them; the price series cannot confirm it. The second is the big character card that repriced and did not come back: Charizard GX at 76% below and a year since the high, M Charizard EX at 60%, Pikachu & Zekrom GX at 56% and only 97 days off its peak. Umbreon V is the one everyone will look for, and at 43% below a $688 print it is the most expensive drawdown in the book by dollars, though not by percentage.
What a full recovery looks like, and the cards that never fell
Cards priced $25 or more now that sit within 5% of their high, ranked by gain since January 2025
| Card | Set | January 2025 | Now | Multiple | Deepest drawdown on the way |
|---|---|---|---|---|---|
| Plusle | Dark Explorers 39 | $2.14 | $31.01 | 14.5x | 27.0% |
| Electrode | Team Up 39 | $3.86 | $46.04 | 11.9x | 9.7% |
| Pikachu | SM Black Star Promos SM98 | $6.56 | $62.15 | 9.5x | 9.9% |
| Pikachu | McDonald's Collection 2016 | $5.45 | $43.39 | 8.0x | 45.8% |
| Pikachu | SM Black Star Promos SM206 | $4.21 | $31.20 | 7.4x | 5.6% |
| Pikachu | SM Black Star Promos SM86 | $5.75 | $35.66 | 6.2x | 5.3% |
| Pikachu | SM Black Star Promos SM81 | $5.75 | $33.01 | 5.7x | 8.5% |
| Kyogre | SM Black Star Promos SM129 | $6.14 | $34.51 | 5.6x | 3.1% |
| Dedenne GX | Unbroken Bonds 195 | $5.16 | $28.79 | 5.6x | 6.6% |
| Kyogre-EX | Dark Explorers 26 | $20.94 | $113.11 | 5.4x | 5.9% |
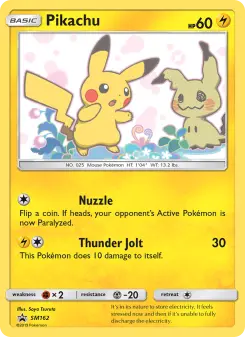
The right-hand column is the point. Electrode went from $3.86 to $46.04 with a deepest drawdown of 9.7%; Kyogre multiplied 5.6 times and never fell more than 3.1% from a running high; Kyogre-EX went to $113.11 with a 5.9% worst fall. The best performers in this book were not the volatile ones. They were cards whose price went up in a staircase and stayed there, most of them SM-era promo Pikachus and the older EX-era and Black & White holos that have the shallowest drawdowns of any cohort here (median 12.8% and 15.8%). The full round trips are rarer and more instructive: Pikachu SM162 started the window at $27.39, printed $175.68 in July 2026, fell 40.7% from a running high somewhere on the way, and sits at $161.62, 8% below that high; Moltres & Zapdos & Articuno GX fell 56.6% at one point and now sits at $157.75 against a $172.76 high; Absol ex from Power Keepers fell 45.8% and is back to $230.48 against $239.98.
Universe: the 2,417 catalog cards (English prints, keyed by TCGplayer product id) whose recorded TCGplayer market price curve in our price store has at least 80 recorded points, spans at least 360 days, and has a point within 14 days of 2026-09-13; median span 593 days, first points 2025-01-27, weekly cadence for most of the window and daily from late July 2026 apart from a gap between 11 and 29 August; the recorded curve alone is used, without the daily canonical price store. Curves come from 40 sets; by era: Sun & Moon 1,226, Sword & Shield 745, other 254, XY 138, Black & White 29, EX era 25. Price now is the median of the last ten recorded points; start price the median of the first ten. Deepest drawdown is the largest value of 1 minus price over running maximum across the curve; distance from high is 1 minus price now over the window maximum; a card is within 5% of its high when that distance is 0.05 or less. Tier tables sort on start price unless stated. The 30% episode is the first point at which drawdown from the running high reached 30%; forward returns compare the first recorded price on or within 7 days after the trigger date plus 90 or 180 days to the price on the trigger date, only where that horizon had elapsed by 2026-09-13 (198 and 183 of 210 episodes); an episode counts as regained when a later point reaches 95% of the pre-fall high, and days to regain are counted from the trigger. The unconditional baseline takes every 90-day window starting every 30 days from each $5+ card's first point (20,340 windows). Peak months use the date of the window maximum. Medians on even samples average the two middle values. Recorded prices are TCGplayer market prices for the flagship printing, not sold prices, and can move on a single relisting for thin cards. Not financial advice.