
A drawdown is how far something falls from its own high water mark, and it is the risk number that matters to anyone actually holding a card rather than modelling one. We measured it for every card with a deep recorded weekly tape to 2026-09-22: 2,766 cards, a median of 603 days each, every card judged only against its own peak. Say the population before any of the numbers, because it decides two of them. These are the 13.92% of products on that tape that were still being quoted after twenty months, so a card that fell hard and was then delisted is not here at all. The median maximum drawdown among the survivors is 22.48%. Three quarters of them, 77.11%, sat below their own recorded peak on the last week of the tape. And among survivors 74.55% eventually regained the peak that produced their worst fall, which is the optimistic half of the same sentence and an upper bound rather than an estimate.
Most cards fall a fifth; a few fall almost everything
The shape here is more useful than a worst-ten list. Half the population had a maximum drawdown between 12.13% and 33.51%, the quartile bounds. 20.43% never fell as much as a tenth from their peak. At the other end, 7.52% fell by half or more and 0.33% fell by 90% or more. This is a market where a 20% fall is the ordinary experience of holding and a 50% fall is a one-in-thirteen event over roughly twenty months.
Maximum drawdown from a card's own running peak, 2,766 cards, tape to 2026-09-22
| Maximum drawdown | Cards | Share | Of those, share that regained the peak |
|---|---|---|---|
| no drawdown at all | 2 | 0.07% | 100.00% |
| under 10% | 565 | 20.43% | 86.90% |
| 10 to 25% | 980 | 35.43% | 79.80% |
| 25 to 50% | 1,011 | 36.55% | 69.34% |
| 50 to 75% | 159 | 5.75% | 42.77% |
| 75 to 90% | 40 | 1.45% | 40.00% |
| 90% or worse | 9 | 0.33% | 22.22% |
The recovery column is the part worth carrying away. A card that fell less than 10% regained its peak 86.90% of the time; a card that fell by half regained it 42.77% of the time; a card that fell 90% regained it 22.22% of the time. Depth of fall and probability of recovery move together, monotonically, across every band. That is not a law of markets, it is an observation about this population over this window, and the window was a rising one.
Distance below the all-time recorded peak at the last recorded week
| Position | Cards | Share | Median weeks spent under the peak |
|---|---|---|---|
| at the peak | 633 | 22.89% | 0 |
| under 10% below | 1,183 | 42.77% | 23 |
| 10 to 25% below | 671 | 24.26% | 49 |
| 25 to 50% below | 237 | 8.57% | 59 |
| 50 to 75% below | 36 | 1.30% | 72 |
| more than 75% below | 6 | 0.22% | 68 |
Time underwater scales with depth in the same way. A card sitting 10 to 25% below its peak had, at the median, been below that peak for 49 weeks. A card 25 to 50% below had been under for 59 weeks. Being down is not usually a moment; it is a season that lasts about a year.
Why the deepest percentage falls are not the biggest losses
The twenty deepest drawdowns in this census are almost all sub-dollar cards, and that is a tick-size artifact rather than a crash. Of the 208 cards that fell 50% or more, 60 of them, 28.85%, have a trough quote of five cents or less, and the median peak price among those is $0.16. A card going from 25 cents to 2 cents reads as a 92% drawdown and is really a two-cent move at the bottom of the quoting grid. Any drawdown study that publishes a worst-ten list without this check publishes a list of penny cards. Where Money Went to Die avoided the trap the other way, by imposing a $10 floor and requiring 200 daily points, which bought a clean worst-case list of 425 cards at the cost of being unable to say what the typical card does. This study takes the whole population and reports the floor's effect as a table instead.
The same census restated above price floors, price measured at the start of each card's tape
| Floor at tape start | Cards | Median maximum drawdown | Share falling 50% or more | Share that regained the peak | Share under peak at the end |
|---|---|---|---|---|---|
| no floor | 2,766 | 22.48% | 7.52% | 74.55% | 77.11% |
| $1 and up | 1,772 | 18.38% | 3.67% | 74.44% | 75.79% |
| $5 and up | 903 | 12.82% | 2.88% | 73.75% | 70.87% |
| $25 and up | 283 | 10.64% | 2.47% | 75.62% | 61.84% |
| $100 and up | 68 | 12.13% | 4.41% | 79.41% | 52.94% |
The floor changes the drawdown number a great deal and barely touches the recovery rate. Median maximum drawdown falls from 22.48% with no floor to 10.64% above $25, while the share regaining their peak moves only between 73.75% and 79.41% across every floor. Expensive cards do not fall less often; they fall less far in percentage terms, because their quotes are not being rounded to the nearest cent. Note also the last column: above $100 only 52.94% sat under their peak at the end, against 77.11% with no floor, though that band holds only 68 cards and should be read as a hint rather than a result.
The fifteen deepest drawdowns among cards that started at $25 or more, n = 283
| Card | Set | Peak | Trough | Drawdown | Peak to trough | Status |
|---|---|---|---|---|---|---|
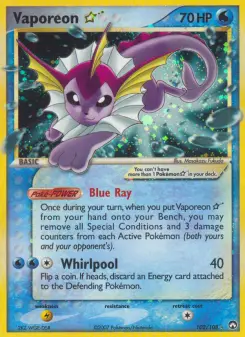
| Vaporeon ☆ | Power Keepers | $1,999.99 | $450.00 | -77.50% | 2025-07-28 to 2026-02-09 | still under |
| Jolteon ☆ | Power Keepers | $760.00 | $219.95 | -71.06% | 2025-01-27 to 2026-05-10 | still under |
| Nest Ball | Sun & Moon | $27.32 | $9.13 | -66.58% | 2025-01-27 to 2026-09-22 | still under |
| Umbreon GX | Sun & Moon | $97.93 | $35.03 | -64.23% | 2025-04-14 to 2025-10-06 | still under |
| M Charizard EX | XY Evolutions | $106.98 | $41.30 | -61.39% | 2025-09-15 to 2026-08-26 | still under |
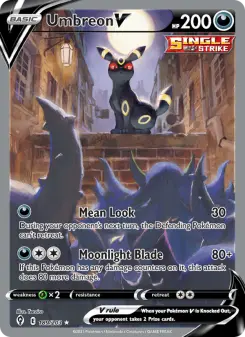
| Umbreon V | Evolving Skies | $687.88 | $297.36 | -56.77% | 2025-09-29 to 2026-01-26 | still under |
| Moltres & Zapdos & Articuno GX | SM Black Star Promos | $127.51 | $55.34 | -56.60% | 2025-06-23 to 2025-11-03 | regained |
| Absol ex | Power Keepers | $114.48 | $62.07 | -45.78% | 2025-10-06 to 2025-10-13 | regained |
| Mew V | Fusion Strike | $151.64 | $82.85 | -45.36% | 2025-09-08 to 2025-12-29 | still under |
| Charizard & Braixen GX | SM Black Star Promos | $118.16 | $67.24 | -43.09% | 2025-06-30 to 2026-02-16 | still under |
| Kyogre-EX | Dark Explorers | $500.00 | $284.67 | -43.07% | 2025-05-26 to 2025-09-01 | regained |
| Flareon VMAX | SWSH Black Star Promos | $73.87 | $42.29 | -42.75% | 2025-09-15 to 2026-03-02 | still under |
| Lillie | Sun & Moon | $73.73 | $43.25 | -41.34% | 2025-03-24 to 2025-12-22 | still under |
| Rotom V | Lost Origin | $35.50 | $21.04 | -40.73% | 2025-03-17 to 2025-08-04 | still under |
| Pikachu SWSH020 | SWSH Black Star Promos | $122.19 | $73.71 | -39.68% | 2025-10-13 to 2026-01-26 | still under |
Twelve of those fifteen never regained the peak that produced their worst fall, which is what the Status column records. On the stricter reading, distance below the all-time recorded peak at the last recorded week, all fifteen are still under. The two Power Keepers gold-star cards at the top of the list are worth a second look because they are the same archetype twice, the high-priced thin-listing vintage where a drawdown is often the withdrawal of an optimistic ask rather than a sale at a lower price. The modern entries behave differently: Umbreon V fell 56.77% over four months in a set that remains among the most actively quoted we hold, and that one looks like a market.
Population: the per-card weekly `ppthist:<tcgId>` series in `api_cache`, joined to `cards` on `tcg_id`, restricted to cards whose series reaches 2025-01-27 and carries at least 40 points. That is 2,766 cards of the 19,876 on the tape, with a median recorded span of 603 days and a maximum of 603, the modal last recorded date being 2026-09-22. Prices are TCGplayer market prices, which are ASKS; no sold median appears anywhere in this study. Every panel is keyed on the TCGplayer product id and carries exactly one row per product. 51,719 catalogue rows carry a TCGplayer product id, and they resolve to 50,507 distinct ids: 1,212 ids are claimed by two rows each, 2,424 rows in all. Those pairs are not a Japanese print against its English twin, which is what we assumed before counting them. Every one of the 1,212 is a same-language pair, 972 Japanese and 240 English, and they are overwhelmingly one product indexed under two catalogue spellings of the same set, as the XY trainer kits are. Each id collapses to a single row, preferring an English row and then the lexically first catalogue id, so no product enters a cross-section, a factor sort or a census twice. The tie-break is stated rather than assumed away, because it decides which of the two spellings a shared product is filed under. For each card the running peak is recomputed forward through its own series and the drawdown at each point is the price divided by the running peak minus one; the maximum drawdown is the most negative such value. A card counts as having regained its peak if any later point in its own series reaches or exceeds the peak that produced its maximum drawdown. Weeks under the peak counts backward from the last recorded point until a point at or above the all-time recorded peak is reached. Every card is compared only to its own history: no card is measured against a peak it was not quoted at, and no cross-card benchmark is used. A card counts as BELOW its peak only when its last price sits more than 0.01% under it, so that a floating-point remainder is not published as a drawdown; an independent recompute using a strict zero instead gets 2,134 cards under peak rather than 2,133, and the same one-card offset moves the deepest floor row from 61.84% to 62.19%. The threshold is the reason, not a disagreement about the data. Price-floor restatements use the price at the FIRST point of each card's own tape, never the last, so the floor cannot select on outcome. The median convention is the upper-middle element on even samples. The penny-floor check counts cards whose trough quote is five cents or less among those falling 50% or more.