Every graded-card conversation eventually reduces to one number: what is the 10 worth over the 9? The market's answer turns out to be neither constant nor random. Across 520 cards and eight eras of Moonstone market data joined to the PSA registry itself, the gem premium runs from barely 2.5× in high-population modern sets to nearly 9× in the DP era — and population structure alone explains almost half of that variation. The half it explains gives you a fair-value curve. The half it doesn't gives you a screen: a ranked list of graded cards trading measurably away from where their own population says they should.
A 10 is worth 2.5× to 9× a 9 — era decides
The median PSA 10 premium over a PSA 9 is not a hobby constant. It is an era signature, and it tracks how hard the 10 is to make. WotC and the 2003–2011 sets — dark borders, silver holofoil that scratches if you look at it — carry 5–9× gem premiums. Sword & Shield, printed in an era of sleeve-fresh pulls and 55% gem rates, carries 2.6×. Scarlet & Violet sits at 3.7× despite enormous print runs, because its textured secret rares reintroduced real grading risk.
PSA 10 price ÷ PSA 9 price, median by era
The second rung of the ladder is far flatter — and that asymmetry is the single most practical fact in graded-card pricing. A 9 commands only 1.2–2.3× an 8. Nearly all of the condition premium in this market is concentrated in the final step from 9 to 10. Paying up for an 8-to-9 upgrade buys you little; the entire game is the gem.
The full ladder by era (median multiples)
| Era | 10 ÷ 9 | 9 ÷ 8 |
|---|---|---|
| WotC 1999–2003 | 5.20× | 1.54× |
| EX 2003–2007 | 7.22× | 1.80× |
| DP–HGSS 2007–2011 | 8.82× | 2.14× |
| BW 2011–2014 | 6.75× | 1.93× |
| XY 2014–2017 | 7.08× | 2.25× |
| SM 2017–2019 | 4.15× | 1.34× |
| SWSH 2020–2022 | 2.59× | 1.22× |
| SV 2023–2025 | 3.66× | 1.18× |
Scarcity is priced — measurably
Why does the premium vary? Because the market is quietly reading the same registry we are. Sort every card in the study by its PSA 10 population and the gem premium falls in lockstep: cards with double-digit 10 populations trade at 7.7× their 9s; cards with five-digit 10 populations trade at 2.5×. There is no bucket where this reverses.
Gem premium by PSA 10 population
Where PSA 9s are trading away from fair
Invert the curve and every card gets a population-implied fair price for its PSA 9, anchored to its own PSA 10 market. The gap between fair and actual is a discrepancy score. These are the largest gaps in the study among liquid cards — at least ten recorded sales at both grades. A 9 trading 50–65% under its pop-implied fair value is one of three things: a market inefficiency, a stale 10 price about to correct downward, or collapsed collector demand below gem. The screen doesn't decide which — it tells you exactly where to look.
Largest PSA 9 discounts vs. population-implied fair value
The discrepancy screen — PSA 9 trading below pop-implied fair (July 2026)
| Card | PSA 10 | PSA 9 | Fair 9 | Gap | Pop 10 / Pop 9 |
|---|---|---|---|---|---|
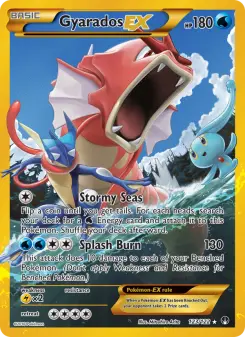
| Gyarados EX · BREAKpoint | $3,500 | $248 | $703 | −65% | 1,472 / 2,782 |
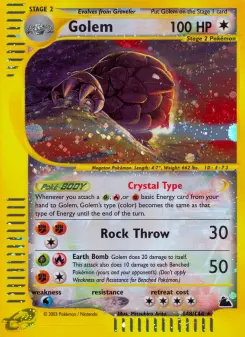
| Golem · Skyridge | $7,775 | $675 | $1,726 | −61% | 257 / 392 |
| Maushold · Paldea Evolved | $1,900 | $111 | $273 | −59% | 392 / 1,510 |
| Arceus & Dialga & Palkia GX · Cosmic Eclipse | $4,575 | $476 | $1,164 | −59% | 1,660 / 1,895 |
| Umbreon EX · Fates Collide | $4,201 | $344 | $753 | −54% | 706 / 1,701 |
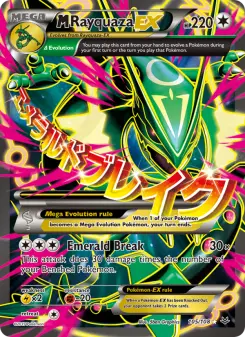
| M Rayquaza EX · Roaring Skies | $25,000 | $1,411 | $3,062 | −54% | 116 / 629 |
| Charmander · SVP Promos | $5,600 | $326 | $706 | −54% | 680 / 3,465 |
| Umbreon & Darkrai GX · SM Promos | $6,885 | $386 | $835 | −54% | 1,133 / 6,270 |
| Mew · XY Black Star Promos | $9,000 | $472 | $1,022 | −54% | 160 / 1,020 |
| Pikachu EX · XY Black Star Promos | $8,000 | $505 | $1,092 | −54% | 81 / 349 |
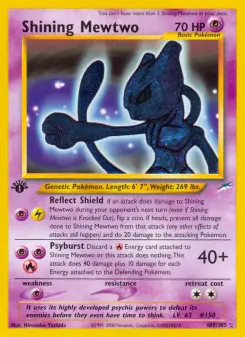
The opposite tail is just as informative. PSA 9s trading far above their pop-implied fair value cluster overwhelmingly in one place: Neo Destiny. Shining Mewtwo's 9 trades at 2.4× fair; Shining Celebi's at 2.7×; Dark Crobat's at 4×. This is not necessarily overpricing — it is what condition-rarity substitution looks like. When the 10 is functionally unbuyable (pop 299, five figures), collector demand concentrates one rung down and the 9 becomes the real market. A rich 9 under an unobtainable 10 is a structural feature; a rich 9 under a liquid, affordable 10 is a warning.
The hardest 10s in the hobby
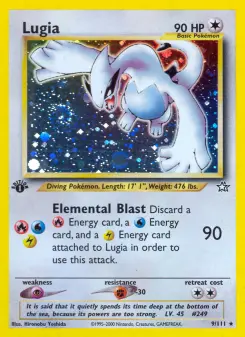
Gem rate — the share of a card's entire graded population sitting at PSA 10 — is the cleanest difficulty measure the registry offers, and the spread is staggering: the median SWSH holo gems at 55%; the median WotC 1st Edition holo gems at 4.2%. At the extreme, first-edition Neo Genesis Lugia has produced fifteen 10s from 11,911 attempts — a 1-in-794 event. Every submission is a lottery ticket, and the ticket price is a raw copy plus grading fees.
Lowest PSA 10 rates on record (populations ≥300)
| Card | Printing | Gem odds | Total pop | PSA 10s |
|---|---|---|---|---|
| Rayquaza C · DP Promos | Holofoil | 1-in-1,196 | 1,196 | 1 |
| Blissey · Neo Revelation | 1st Ed. Holo | 1-in-1,011 | 1,011 | 1 |
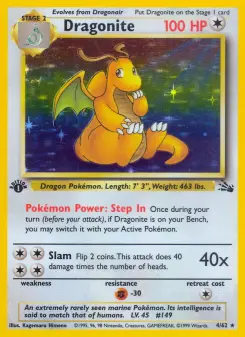
| Lugia · Neo Genesis | 1st Ed. Holo | 1-in-794 | 11,911 | 15 |
| Ho-Oh ex · POP Series 3 | Non-holo | 1-in-695 | 695 | 1 |
| Dialga · XY Promos | Holofoil | 1-in-315 | 946 | 3 |
| Gyarados · XY Promos | Holofoil | 1-in-313 | 625 | 2 |
| Rayquaza EX · XY Promos | Holofoil | 1-in-295 | 2,068 | 7 |
| Dragonite · Fossil | 1st Ed. Holo | 1-in-274 | 16,464 | 60 |
| Sabrina's Gengar · Gym Heroes | 1st Ed. Holo | 1-in-252 | 8,566 | 34 |
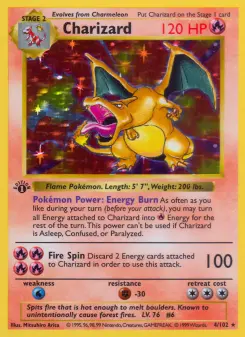
| Charizard · Base Set | 1st Ed. Holo | 1-in-251 | 14,555 | 58 |
Median gem rate by era and printing
Certified scarcity — the gems the registry says almost never happen
Gem scarcity has not been a momentum trade
The natural assumption — rarest 10s appreciate fastest — fails the data, at least over the recent window we can measure. Splitting the study by gem rate and tracking raw-market prices over the past 180 days, the hardest-to-gem quartile appreciated the least and the easiest quartile the most. Recent money has chased modern, high-velocity, easy-gem product; certified scarcity has been a store of value, not a source of momentum. Scarcity sets the LEVEL of the gem premium (the quintile chart above); it has not driven the RATE of recent appreciation.
180-day raw-market price change by gem-rate quartile
Universe: 520 cards sampled across eight English-language eras (top-of-market plus stride-sampled mid-tier per era), priced from median recorded eBay sale prices per PSA grade with stated sample sizes, as of July 2026. Populations are true PSA registry counts (per-grade and total) as of the same date. 286 cards had ≥4 recorded sales at both PSA 10 and PSA 9; 17 additional cards showed grade-inverted or >40× medians and were excluded as comp-matching artifacts rather than smoothed. The fair-value fit is a one-factor log-log regression of the 10÷9 price ratio on the 9÷10 population ratio (n=278, both pops ≥20); screen entries additionally require ≥10 sales at both grades. The 180-day momentum series measures raw (ungraded) market prices — per-grade price history is not yet deep enough to measure graded returns directly; Moonstone records daily graded snapshots to close that gap. Figures update continuously on linked product pages and will drift from the captured values. Nothing here is financial advice.