

Every portfolio tracker in this hobby, ours included, shows you a number and a change. The number is a market price and the change is that price against an earlier one, and the whole apparatus quietly assumes the price is a live thing that gets updated when the world changes. We finally measured how live it is. Across 7,014 cards with long price histories we hold 756,262 observations. In the period since June 8, 2026, when the feed began delivering daily points, 72.0% of observations exactly one day apart are identical to the cent and 37.5% of observations exactly seven days apart are identical to the cent. The typical card on our book spends most of its life not being repriced at all.
One era, or the comparison means nothing
This measurement has a trap in it and an earlier version of this piece walked into it. Our history feed changed cadence in June 2026: before that it delivered one point a week, after it delivers one a day. Naively counting every pair of observations exactly seven days apart therefore counts almost entirely PRE-June data, and counting every pair one day apart counts only POST-June data. The two headline numbers would then come from disjoint eras and could not be compared, which is exactly what a 42.1% weekly figure sitting beside a 72.0% daily figure was doing. Restricting both to the daily era, where a card can supply both a one-day and a seven-day pair, gives 72.0% at one day and 37.5% at seven, on the same 6,684 cards over the same eighty-four days. For completeness the older weekly era gives 42.2% at seven days, so the feed did not become dramatically staler; it is a genuinely different sample and it is labelled as one.
Which prices freeze
Share of observations identical to the earlier reading, by the card's current price (daily era only)
| Price band | Cards in the sample | Day-apart pairs | Identical, 1 day | Week-apart pairs | Identical, 7 days |
|---|---|---|---|---|---|
| Under $0.25 | 1,265 | 69,937 | 75.4% | 63,291 | 42.4% |
| $0.25 to $1 | 2,286 | 120,950 | 76.4% | 109,281 | 43.7% |
| $1 to $5 | 1,767 | 87,887 | 67.4% | 79,207 | 37.8% |
| $5 to $20 | 994 | 55,175 | 64.3% | 50,344 | 24.7% |
| $20 to $100 | 521 | 29,295 | 72.1% | 26,754 | 27.0% |
| Over $100 | 181 | 9,587 | 77.3% | 8,728 | 29.5% |
The seven-day column is the one to read, and it is not the monotone story anyone would predict. Cheap cards freeze because nobody bothers: 42.4% of week-apart readings on sub-quarter cards are unchanged, and 43.7% in the quarter-to-a-dollar band. Mid-priced cards, the $5 to $100 range, are the liveliest thing on the board at 24.7% to 27.0% frozen, because that is where a card is expensive enough to be worth quoting and cheap enough to actually trade every week. And then the top band ticks back up to 29.5%, on 8,728 observations, which is the small but real signature of a card too expensive to change hands often enough to keep its quote moving. The relationship between price and staleness is a U, not a line, and the bottom of the U is where price discovery actually happens. One note on how to read that table: the Cards column counts the full 7,014-card sample and sums to it, while the pair columns count only the 6,684 cards that supply both spacings and sum to the two headline pair totals. The two columns therefore describe slightly different populations, and the rates are the pair columns' rates.
The stretches, not the ticks
A repeat rate could still describe a market that ticks every other week, so we measured the runs instead. For each of the 7,014 cards we found the longest continuous stretch in the twelve months to August 2026 during which the price never changed by a cent. The median card's answer is 28 days. The 75th percentile is 63 days, the 90th is 138 days, and the maximum is 362 days, a card whose quote did not move once in a year. A quarter of the sample, 1,774 cards, sat completely still for at least 60 consecutive days, and 1,165 of them, 16.6%, for at least 90. One hundred and ninety-five cards never changed price at all across the full span of their history in our cache.
This reframes what a percentage change on a card page means. When a card that has been still for eleven weeks finally prints a different number, that is not an eleven-week trend resolving. It is a single new data point arriving, and the entire move is attributable to whatever happened in the last transaction rather than to anything the eleven weeks contained. The change number is real, its timing is arbitrary, and the shorter your lookback window the more likely you are reading arrival timing rather than market movement.
The cross-check, and what it is not
We have a second view of the same thing. Our own daily price dump has been accreting since August 30, 2026, and on the 51,764 cards priced on both August 30 and September 2, 59.5% carried the identical price three days apart. That is consistent with the 72.0% at one day and 37.5% at seven. It is important to be clear about what that consistency is worth: the dump and the history feed both read the same upstream market price field, so this is one instrument sampled at two cadences, not two instruments agreeing. It rules out an error in our own aggregation. It does not independently confirm that the underlying field is stale, and no measurement we can run on that field could. The dump also supplies its own illustration of the point. It holds four day buckets and only three distinct snapshots: the September 1 bucket is identical to August 31 on every one of the 51,827 rows they share, because the feed did not deliver that day.
The same caution applies to a curiosity we found in that window and are deliberately not reporting as a market event. Two set-level sums, Aquapolis and Base Set Shadowless, moved sharply between August 30 and September 2. Neither is plausible as trading. Both sets carry their value in a handful of four-figure cards, and a single upstream revision on one of those rows swings the sum. When a feed is this quiet, the few things that do move are disproportionately likely to be revisions rather than trades, and a set index that reports them as performance is manufacturing news out of maintenance.
What to do with a stale number
Three habits fall out of this. First, treat any single quoted price as a claim with an age, and ask what the age is before you treat a move as information; on our card pages the sale count and the last-sale date answer this, and our how many sales is a price study sets the thresholds. Second, prefer measurements built on transactions over measurements built on quotes whenever both exist, because a sold median with a sample size attached carries its own evidence and a market price does not. Third, be extremely suspicious of short-window percentage changes on expensive cards, which our table says are among the most likely to be sitting on a quote that predates the window entirely. The most honest thing a price display can do is tell you when it last learned something, and most of them, most of the time, learned nothing this week.
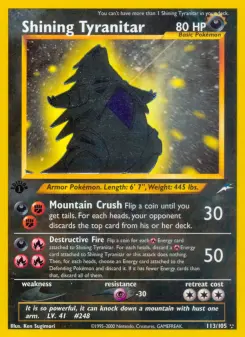
Primary source: 7,039 cached per-card price histories read from moonstone production on September 2, 2026, of which 7,014 carried at least eight usable observations, holding 756,262 observations and 749,248 consecutive pairs in total; an earlier version of this piece described the 749,248 pairs as observations. Series start dates range from September 2024 to August 2026 and end dates from September 2025 to August 2026. The feed changed cadence in June 2026, from weekly to daily, and this matters more than any other methodological choice here: pairs exactly one day apart exist only from June 8, 2026 onward, and pairs exactly seven days apart are overwhelmingly pre-June. All headline repeat rates are therefore computed on the DAILY era only, from June 8 to August 31, 2026, where the same 6,684 cards supply both spacings: 372,831 pairs one day apart, 337,605 pairs seven days apart, both built by looking up each observation's counterpart at an exact date offset rather than by walking adjacent points. The pre-June weekly era gives 42.2% identical at seven days on 363,745 pairs and is reported separately rather than averaged in. Identical means equal to the cent. Frozen-stretch lengths are measured within the window from September 1, 2025 onward and are reported in days between the first and last observation of an unchanged run, so a run bounded by weekly observations is measured at weekly resolution and its true length may be slightly longer. The three-day cross-check uses our own daily price-history table at day buckets 20695 and 20698 (August 30 and September 2, 2026), 51,764 cards priced on both days; that table's earliest bucket is August 30, not August 29 as an earlier version stated, and its four buckets contain three distinct snapshots. Both sources read the same upstream market-price field and are therefore one instrument at two cadences, not two independent instruments; that is stated in the body rather than only here. In the price-band table the Cards column is the full 7,014-card sample and the pair columns are the 6,684 cards supplying both spacings, so the two halves of each row count slightly different populations. The Shining Tyranitar quote in the hero row, $4,249.99, is the recorded market price on September 2, 2026, and it was the card's 1st Edition Holofoil leg under the dearest-printing rule this site retired in September 2026; the canonical Unlimited Holofoil price is $662.25, and the card page now shows that. The cached history read for this piece has since grown from 7,039 series to more than 26,000, mostly daily ones, so the repeat rates recompute close (72.0% to 73.7% at one day, 42.2% to 42.3% in the weekly era, 37.5% to 40.9% at seven days) while the frozen-stretch figures, which are measured at the resolution of whatever observations a series happens to carry, do not: on that larger and denser sample the median longest stretch reads 12 days rather than 28. The stretch figures are true of the September 2, 2026 sample and are not reproducible on today's coverage. This piece measures quote staleness, which is a property of the price feed, and is not a measurement of trading volume.