
Every listing that wants your grading money quotes the same statistic: this card trades at eight times raw in a PSA 10, so send it in. We finally measured what that number is made of. Take every card on our book with a live raw price and a PSA 10 median built on at least ten verified sales, 306 of them as of September 2, 2026, and sort them by nothing but how much the raw copy costs. The multiple falls in a near-perfect staircase from 16.02x in the $4 to $8 band to 2.63x in the $256 to $1,024 bands. It is not a staircase about cards. It is a staircase about price.
The ladder, rung by rung
Median PSA 10 multiple over raw, by raw price band (September 2, 2026)
| Raw band | Cards | Median raw | Median PSA 10 | Median multiple | Median gem rate |
|---|---|---|---|---|---|
| $4 to $8 | 13 | $5.22 | $84.05 | 16.02x | 53.6% |
| $8 to $16 | 27 | $12.45 | $131.09 | 10.62x | 49.9% |
| $16 to $32 | 34 | $23.92 | $175.38 | 7.64x | 35.3% |
| $32 to $64 | 71 | $47.21 | $230.00 | 5.09x | 36.9% |
| $64 to $128 | 55 | $86.61 | $317.50 | 3.66x | 38.3% |
| $128 to $256 | 43 | $196.67 | $498.00 | 2.70x | 49.5% |
| $256 to $512 | 30 | $344.07 | $826.50 | 2.63x | 43.6% |
| $512 to $1,024 | 18 | $616.70 | $1,699.24 | 2.63x | 49.8% |
| $1,024 to $2,048 | 10 | $1,341.81 | $3,767.76 | 2.77x | 47.9% |
Read the last four rows again, because that is the part nobody tells you. The compression is violent up to about $128 and then it simply stops: 2.70x, 2.63x, 2.63x, 2.77x, four consecutive bands spanning an eightfold range of raw price and landing within 0.14x of each other. Above roughly $128 raw, the gem premium is a flat tax of a bit under three times, whatever the card is. Below it, the premium is doing most of the work in the price. That single fact reorganises how a grading decision should be argued: on a $12 card the stamp is the asset, on a $600 card the stamp is a rounding error attached to an asset you already own.
Two variables, and neither of them is your card
The obvious model is the wrong one, and we ran it anyway so we could show you why. Regress the log of the MULTIPLE on the log of the raw price and the card's lifetime gem rate, across the 282 cards carrying both readings, and you get 35.9% for price alone, 21.7% for gem rate alone, 59.4% together. Those price figures are not evidence of anything. The multiple is the PSA 10 median divided by the raw price, so raw price sits on both sides of that equation and a negative slope on it is guaranteed before a single card is measured. Any spec built that way will look impressive and prove nothing.
So here is the honest test, on the same 282 cards. Put the PSA 10 price itself on the left and regress its log on the log of the raw price and the gem rate, a specification that has no arithmetic obligation to slope any particular way. Raw price alone explains 59.7% of where a PSA 10 lands, gem rate alone 16.7%, the two together 74.5%. And the ladder survives the switch, because in this form the claim is an elasticity rather than a correlation: the coefficient on log raw price is 0.61, with a standard error of 0.02, sixteen standard errors below the 1.00 that would mean gem premiums are constant across the price ladder. A card ten times more expensive raw carries a PSA 10 only about four times dearer. That is the compression, measured in a form that could have come out flat and did not. Two numbers you can look up before you have thought about the character, the artist, the set, the print run, or the nostalgia pin down about three-quarters of where the graded price lands. The remaining quarter is the only part that is about the card, and it is the only part worth arguing over.
What the two-variable fit expects a PSA 10 to pay
| Raw price | Gem rate 15% | Gem rate 42% | Gem rate 70% |
|---|---|---|---|
| $10 | 19.56x | 10.83x | 5.87x |
| $50 | 10.44x | 5.78x | 3.13x |
| $200 | 6.08x | 3.37x | 1.82x |
| $1,000 | 3.24x | 1.80x | 0.97x |
The era table falls straight out of this and stops being mysterious, though it has to be read with its sample sizes visible. Cards from the Wizards years carry a median 17.03x multiple on 11 cards, and Ruby and Sapphire era cards land on the same 17.03x on 5. That identical figure is a coincidence of two thin cells rather than a shared constant, and we checked it rather than quietly rounding it apart: the two medians genuinely print the same number, on 11 and 5 cards. Sword and Shield, on 95 cards, carries 3.07x. The romantic reading is that vintage is special. The measured reading is that the WOTC cards on our book gem at a median 4.6%, on the 9 of those 11 that carry a recorded gem rate, and the Sword and Shield cards gem at 54.7% on 93 of 95. The EX cell is thinner still, 5 cards with 2 recorded gem rates, so treat its multiple as a direction rather than a level. Feed a 4.6% gem rate into the fit and you get a vintage-looking multiple out of a model that has never heard of the 1990s. Scarcity of the stamp, not age of the cardboard, is what the premium is buying.
The residual is the trade
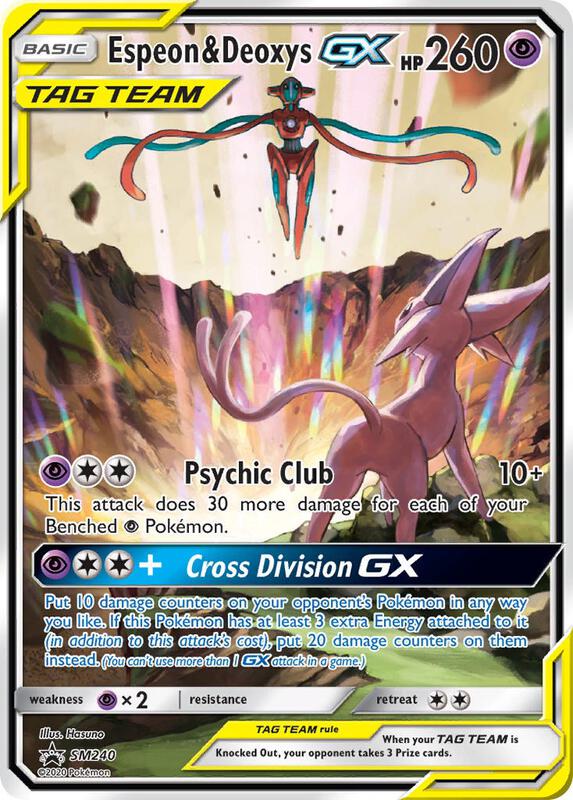
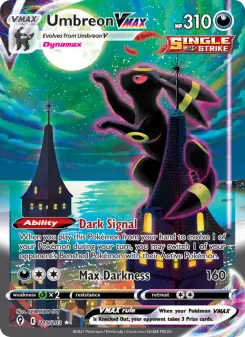
What the fit cannot explain is where the interesting cards live. Espeon & Deoxys GX trades at 35.50x, four times what its $122.53 raw price and 8.3% gem rate predict, on a $4,350 PSA 10 median across 76 verified comps. Salamence ex from Power Keepers runs 3.81x its expectation, Gyarados EX from BREAKpoint 3.68x. And the most instructive outlier is not a rarity at all: Umbreon VMAX from Evolving Skies prints a 1.77x multiple that the hobby reads as cheap, when at a $2,378.74 raw price and a 69.4% gem rate the ladder expects roughly 0.71x, a PSA 10 trading BELOW the raw card. It is 2.51 times richer than its rung, which is close to the opposite of the popular story about it.
The thin end is just as blunt. Charmander and Pikachu from 151 print 1.32x and 1.65x on 285 and 317 verified comps, roughly a fifth and a quarter of what their price and gem rates predict, which is the signature of a registry that has minted tens faster than demand arrived, the mechanism we tracked card by card in the gem rate drift study. Iono's Bellibolt ex and Kieran sit in the same bucket. If you own the raw copy of a card like this and have been waiting for the stamp to pay you, the ladder says the payment has already been made to somebody else.
What our own target book says when you sort it by rung
We publish price targets on the cards where the evidence clears our gates. As of September 2, 2026 that is 62 rated dossiers out of 195, each with a disclosed formula that divides the card's PSA 10 median by the median multiple of its own price band. Sort those 62 calls by the band they sit in and the ladder shows up again, this time as our own book's opinion. What that engine does with the other 133 dossiers, and how few of its seven signals ever actually vote, is the subject of our audit of the rating engine itself.
The 62 disclosed targets, by raw price band
| Raw band | Rated cards | Median implied upside | BUY calls |
|---|---|---|---|
| $32 to $64 | 6 | +125.8% | 6 of 6 |
| $64 to $128 | 7 | +110.6% | 5 of 7 |
| $128 to $256 | 10 | +11.3% | 2 of 10 |
| $256 to $512 | 23 | -4.2% | 2 of 23 |
| $512 to $1,024 | 16 | -6.5% | 2 of 16 |
Every rated card under $128 raw carries triple-digit median upside. Everything above $256 carries negative median upside. The 13 names in the two cheapest bands carry essentially all of the book's positive expectation, with the $128 to $256 band adding a thin +11.3% on 10 more, and the expensive end of the market, where most of the money and nearly all of the attention sits, is priced at or slightly through what the cohort structure supports. Two of those top-band calls still read BUY, Giratina V from Lost Origin at +57.8% and Mew ex from Paldean Fates at +23.1%, so this is a distribution, not a blanket verdict.
Cohort: the 306 cards in the moonstone report feature table on September 2, 2026 carrying a live raw price, a PSA 10 sold median, and at least 10 verified PSA 10 comps; 282 of those also carry a recorded PSA lifetime gem rate and form the regression sample. Bands are powers of two on raw price; bands holding fewer than 10 cards are computed but not shown, which removes four cells at the extremes, including a $1 to $2 band of exactly ONE card printing 33.33x and a $4,096 band of one printing 1.11x. A single-card band is not a rung and we do not headline one. Multiples divide a verified sold median by a raw market price, which is an ask, so every multiple here is flattered by the same construction described in The Ask Is Lying to You. Two regressions are reported, both ordinary least squares on the same 282 cards and the same two regressors. The multiple-form fit (log of PSA-10-over-raw against log raw price and gem rate) is MECHANICALLY CONSTRAINED, because raw price appears in the dependent variable, so its price term cannot come out positive whatever the market does; it is shown only to be disclosed. The level-form fit (log PSA 10 median against log raw price and gem rate) is the honest test, and it is the one quoted: R-squared 59.7% on price alone, 16.7% on gem rate alone, 74.5% jointly, with coefficients 0.6099 (se 0.0242) on log raw price and -2.1898 (se 0.1723) on gem rate. The two fits describe the same fitted surface: moving log raw price across the equals sign shifts its coefficient by exactly one (-0.3901 becomes 0.6099) and leaves the intercept and the gem-rate term untouched, so the expectations table above is valid under either. What differs is the R-squared, and only the level-form figures mean anything. Explained variance is not a causal claim. Target counts come from the live report payloads on our book on September 2, 2026, 62 rated of 195; targets and upsides are the figures those dossiers print. Not financial advice.