We have published four articles marking our own advice and every one of them had the same hole. The book at thirty days, ninety days of our own grave or trophy, we grade our own homework and the autopsy of our losers all told you how our picks did. None of them told you how anything else did over the same days. That is the difference between a number and a result, so this time we built the comparison first and marked the calls second. The comparison is where the story turned out to be. We can mark our own calls as the 13th percentile of the 23,598 cards we price at two dollars or more, or the 54th percentile of them, from the same returns on the same days, and the only thing that changes is whether the cards we compare against were moving at all.
Three in ten prices never moved at all
Start with the cards rather than with us. Take every product we hold a recorded price for on both August 30 and September 29, 2026, worth two dollars or more on the first day, with cards from sets that released inside the window removed. That is 23,598 products. Now count, for each one, how many days its recorded price differed from the day before. The median answer is two. Twenty eight point six percent of them, 6,742 products, answer zero: the same number every single day for 31 days.
This is why the middle card of the whole group moved 0.00% and only 30.0% of the group went down. Those two figures are not a description of the market, they are mostly a description of how many quotes sat still. A product whose price never changes cannot record a loss, so every one of those 6,742 lands on the winning side of any share-that-fell count for free. Strip them out and count only the 16,856 products whose price moved at least once, and the share that fell goes from 30.0% to 42.0%. Keep going and it gets worse in a straight line.
The same 23,598 products, grouped by how many days their price changed. August 30 to September 29, 2026.
| Days the price changed | Products | Share of the group | Median 31 day move | Share that fell |
|---|---|---|---|---|
| Never | 6,742 | 28.6% | 0.00% | 0.0% |
| 1 to 2 | 5,963 | 25.3% | +1.16% | 36.8% |
| 3 to 9 | 6,515 | 27.6% | +1.98% | 34.1% |
| 10 to 19 | 2,485 | 10.5% | -0.73% | 54.2% |
| 20 or more | 1,893 | 8.0% | -5.63% | 69.3% |
| All of them | 23,598 | 100% | 0.00% | 30.0% |
Share of cards that fell, by how many days their price changed
Now our own calls, against both benchmarks
Every dated buy call in our weekly and daily pick series, collapsed to one row per card per publication date, comes to 134 raw single card calls. 99 of them have a recorded price on their own entry day, and 67 were also held at least seven days before September 29. Those 67, covering 52 distinct cards, are the ledger. The median one is 2.67% lower than the price we printed, 53 of the 67 are down, and the median holding period is 14 days. Every stated horizon on these calls is 12 months or longer, so this is a mark and not a verdict.
Against every card priced between half and double the call's own entry price, on the call's own entry day, the 67 sit at the 12.6th percentile and 13 of them beat their comparison group's middle card. That is a bad scorecard and if we stopped there, the conclusion would be that our list is worse than picking at random. But the cards we call are not random. The median called card changed price on 20 of the 31 days. The median card in the catalogue changed price on two.
So run it again, keeping only comparison cards whose price changed at least as many days as the called card's did, at the same price and over the same days. 61 of the 67 calls still have a group of 30 or more to be measured against. Their median position is the 53.7th percentile, 32 of the 61 beat their group's middle card, and the middle card of those groups fell 3.49%. On a coin flip you would expect 30.5 of 61. We got 32, which two-sided comes out at p = 0.80. There is no skill in that number and no disgrace either. Our calls behaved like the cards they sit among.
The two benchmarks, and the same answer inside every group. 67 calls, marked to September 29, 2026.
| Our calls, grouped by their own price changes | Calls | Median return | Percentile vs every card at their price | Percentile vs cards moving as often |
|---|---|---|---|---|
| Changed on 3 to 9 days | 11 | -1.33% | 23rd | 54th |
| Changed on 10 to 19 days | 21 | -2.04% | 16th | 55th |
| Changed on 20 or more days | 35 | -5.22% | 7th | 49th |
| All 67 calls | 67 | -2.67% | 12.6th | 53.7th |
The six worst and six best calls in the ledger, one row per card


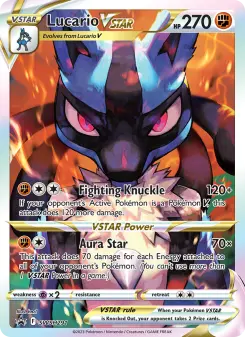
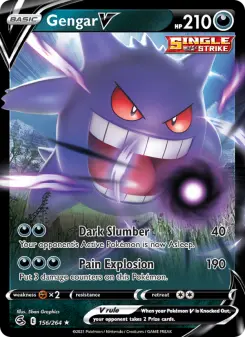
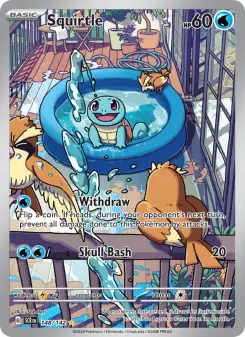





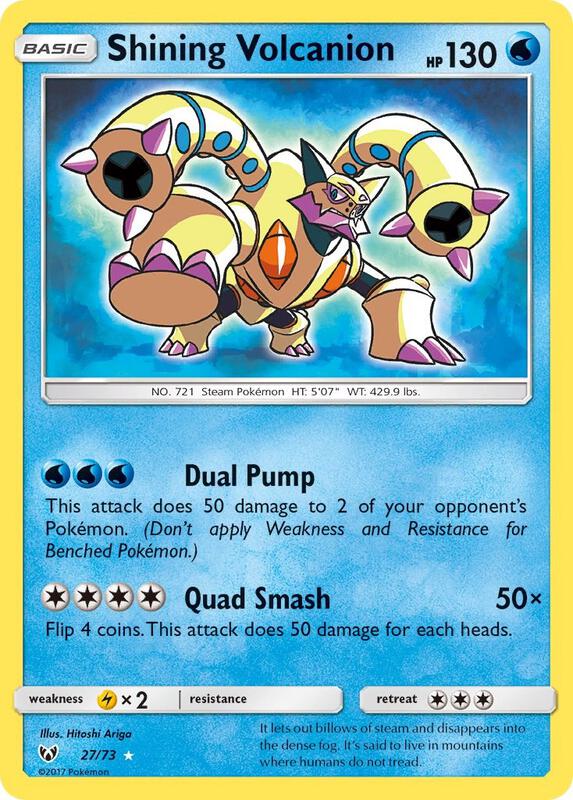
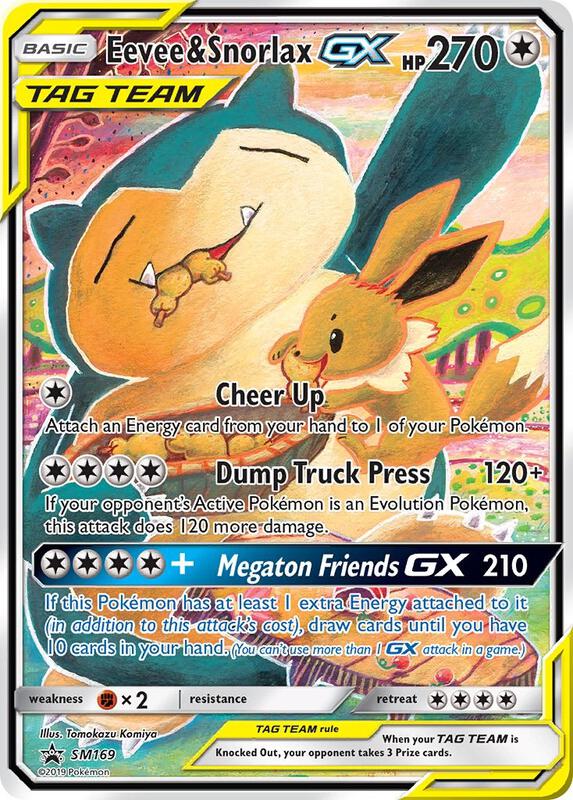
Two things are worth noticing in that list before reading anything else into it. The losers are concentrated in cards whose price moved almost every day: Mew V and Celebi changed price on 25 and 24 days of the 31. Three of the six winners, Alolan Exeggutor GX, Shining Volcanion and Eevee and Snorlax GX, changed price on 12, 12 and 10. That is the same shape the August guides showed, and across all 67 calls it is not there: winners changed price on a median of 7 days, losers on 9. We are showing you the extremes because they are the cards, not because the pattern in them holds.
Read the last two columns across. The more a called card's price moved, the worse it looks against the whole catalogue and the more that appearance is an artifact: the group that changed price on 20 or more days sits at the 7th percentile of all cards and the 49th percentile of cards like it. Our calls are not badly chosen so much as concentrated in the part of the market that moves most, and over these 31 days that part went down while the quieter half of the catalogue, the 53% that changed price on nine days or fewer, drifted up between one and two percent.
The August guides, on the other price file
Our two August 17 buyer's guides, the Pikachu guide and the Snorlax guide, predate the daily file used above, so they are marked on our Near Mint price record instead and their figures never appear in the same statistic as the ledger's. The two records disagree for 58 of the 87 weekly calls where both hold a reading on the entry day, so they are two different measures of a price and not one. Of the 12 cards those guides named, 11 can be marked. WOTC Black Star Promo 1 Pikachu has no Near Mint reading on any day, which is unknown rather than zero, and the guide itself already carries that correction.
The 11 markable August 17 picks, on the Near Mint price record. Both ends of every move are readings from that same record, not the figure the guide printed, so the two ends are like for like. Each card's end date is its own last reading, and its comparison groups are matched to that same pair of dates. Two cards reprice so often that fewer than 30 cards at their price kept pace, which is below the bar the ledger uses, so those two cells report the group size instead of a percentile.
| Card | Recorded Aug 17 | Its last reading | Move | Days its price changed | Percentile vs all cards | Percentile vs cards moving as often |
|---|---|---|---|---|---|---|
| Skyridge Snorlax | $136.21 | $167.02 | +22.6% | 5 | 91st | 94th |
| Jungle Snorlax Holo | $342.03 | $375.66 | +9.8% | 2 | 79th | 82nd |
| Unbroken Bonds Secret Snorlax | $80.32 | $81.55 | +1.5% | 15 | 53rd | 82nd |
| FRLG Snorlax | $102.80 | $101.40 | -1.4% | 3 | 24th | 28th |
| Pikachu ex SIR | $291.55 | $286.77 | -1.6% | 28 | 23rd | n=19, too thin |
| Snorlax delta | $211.13 | $203.85 | -3.4% | 2 | 16th | 19th |
| Lost Origin TG05 Pikachu | $46.39 | $44.67 | -3.7% | 40 | 25th | 72nd |
| Paldean Fates Shiny Pikachu | $80.10 | $74.40 | -7.1% | 27 | 23rd | 54th |
| Snorlax V | $11.21 | $9.57 | -14.6% | 35 | 3rd | 13th |
| 151 Pikachu IR | $90.60 | $76.90 | -15.1% | 41 | 2nd | n=15, too thin |
| Base Set Pikachu | $16.84 | $13.08 | -22.3% | 39 | 1st | 3rd |
Eight of the 11 are down and the median is 3.4% lower, which reproduces what an earlier pass on these same cards found. The benchmark does the same thing here that it did to the ledger: 3 of the 11 beat a comparison group of every card at their price, and 5 of the 9 with a usable group beat a group of cards that were moving as often. The middle card of the first kind of group was up 1.67% across all 11. The middle card of the second kind was down 4.25% across the 9 that have one.
Two calls survive both readings and one fails both. Skyridge Snorlax is up 22.6% and sits above the 90th percentile either way, which is the single best call on either guide. Base Set Pikachu is the worst: we printed it at $15.86 on the back of a doubled quarter and it reads $13.08 today, the 1st percentile of all cards at its price and the 3rd percentile of the ones that were moving. A reader who ignored us in August is offered the same card 17.5% below the number we showed them. That is the call we got most wrong and it is the cheapest one on the page, which is worth saying plainly because we said at the time it was "the cheapest mistake on this page if we are wrong".
Three things we expected to find and did not
First, the picks we held back did not beat the picks we published. Our engine ranks candidates daily and we publish a few, so the 173 it ranked and we did not print look like a free control group against the 65 we did: 105 were cut on rank and 67 on a concentration rule that allows only one pick per species in any rolling 14 days. Raw, the held back calls look much better, down 0.21% at the median against 2.76% for the published ones. That gap is an accident of timing. 77 of the 173 sit on the last three recorded days and 33 of them have no holding period at all, so they are barely marked. Match them day by day and require a week held, and the difference disappears: p = 0.28 across nine day blocks. We report this as nothing found.
Second, buying after a run did not hurt. The rank correlation between a call's move over the 14 days before we printed it and its move after is -0.045 across 44 calls. That is noise, and it kills a tidy story we have told in passing before.
Third, our printed prices are not stale quotes. For 83 of the 87 weekly calls where both exist, the price we published matches the recorded price on its own entry day to within half a percent. Where the two differ on the August guides it is small and cuts both ways: Base Set Pikachu was printed 5.8% under the Near Mint reading and Lost Origin TG05 4.5% over it. Whatever is wrong with our calls, it is not that we quoted prices nobody could get.
Two corrections we owe
Both August guides state in their methodology that "the Market column is an ASK, the price sellers are listing at". That is wrong and it matters, because it invites a reader to discount every figure on those pages as a wish rather than a trade. The column is a market price derived from recent sales. The listing-shaped column in our schema is a different one, the cheapest printing, and it was not what those guides printed.
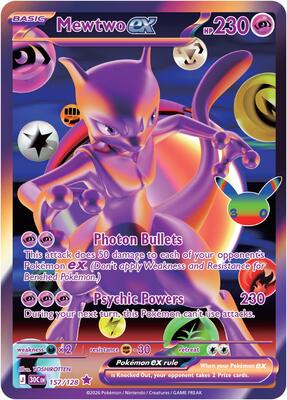
And our five grails note named Mewtwo ex from 30th Celebration at a $1,000 presale quote. On our Near Mint record that quote was exactly $1,000.00 on all 28 days from August 13 to September 9, then $875 for four days and $829.99 for two, and then $103.34 on September 16, the day the set actually released. Its last reading, September 24, is $72.06, which is 92.8% below the presale figure. A 92.8% fall on a card nobody could yet own is not a market move, which is why the card is excluded from every figure in this article and why sets that released inside the window are removed from every comparison group here. It is also the purest illustration of the point this article is built on: for 28 days that card had a price, and the price meant nothing. The other four grails are a five year call marked at six weeks, so they get one line and no conclusion, all three on the Near Mint record used in this section: Base Set Charizard is up 10.4%, Umbreon VMAX is down 5.5%, Umbreon ex SIR is down 7.9%, and we decline to mark Neo Genesis Lugia at all: our daily record reads $1,085.03 for it on August 30 against the $519 the note quoted, we hold no Near Mint reading for it on any day to arbitrate between them, and we will not publish a move we cannot attribute to a printing.
What a buyer does with this
The useful part of this article is not our scorecard. It is the benchmark, and it changes one habit. When you check whether a card you own has done badly, the number you reach for is some version of "the market is up" or "only a third of cards fell". On our own figures that number is built mostly from cards whose price nobody changed. If the card you are checking is one that moves, compare it against cards that move. Over these 31 days that is the difference between a market that looks flat and one where 69.3% of cards fell and the middle one lost 5.63%.
For our own calls the instruction is narrower. On a three week mark our published list is indistinguishable from the cards it sits among, so there is no case for paying up to be early on a pick, and no case for treating a pick as a reason to skip your own read on price. Where our calls did reliably land is in the part of the market that reprices, which is 18.5% of the 23,598 products in this comparison and which fell hard over these weeks. If you want the cards our list points at, you should expect that volatility rather than be surprised by it. What you should not do is take a card 2.67% lower after a fortnight as evidence a 12 to 24 month call failed, and we are not going to pretend our own numbers say otherwise.
SOURCES AND WINDOW. Two price records, never combined inside one figure. `price_history`, the recorded TCGplayer market price of the flagship printing, holds 31 days from August 30 to September 29, 2026 and about 52,400 products a day; it carries the 67 call ledger and the 23,598 product universe. `nm_history`, the Near Mint quote, holds 49 days from August 12 and carries the August 17 guide section only. The two disagree for 58 of the 87 weekly calls where both hold a reading on the call's entry day, so they are two measures rather than one, and the guides section states its own record. `nm_history` is refreshed in rotation, which is why every August pick is marked to its own last recorded day and its comparison groups are matched to that same pair of dates rather than to a shared end date. Neither column is an asking price: the market price is derived from recent sales, and the listing-shaped column in the schema is `price_min`, which is not used here. Neither is a graded figure. UNIVERSE. Every product with a recorded price on both August 30 and September 29, 2026 worth $2.00 or more on the first day, which is 23,598. The $2 floor is there because a one cent change on a fifty cent card is a 2% move and would fill the result with noise. Products are keyed by TCGplayer product id throughout, which is what prevents the 1,215 catalogue ids claimed by two rows each from double counting; where a call had to be named, the catalogue row was chosen by the set name matching the price record and failing that the lower card id. Every product from a set that released inside the window is removed from the universe and from every comparison group, 275 products in total: the two 30th Celebration groups in full, released September 16, plus any product whose own recorded release date falls between August 12 and September 29. CALL POPULATION. 212 weekly calls and 238 engine candidate rows. Of the 212: 4 are sealed and 86 name a graded copy, which cannot be marked against a raw single card price; 27 of those 90 also carry no product id, and the remaining 122 raw single card calls all carry one. Adding the 65 published engine calls and collapsing to one row per card per publication date gives 134. 99 of those have a recorded price on their own entry day; the 35 that do not were published before August 30. 67 of the 99 were held at least seven days to September 29, covering 52 distinct cards, and those 67 are the ledger. A call is marked from the recorded price on its own entry day rather than from the printed figure, so both ends of every return come from the same column; the printed figure matched that reading to within half a percent for 83 of the 87 weekly calls where both exist. COMPARISON GROUPS. For each call, every other product priced on the call's own entry day and on September 29, worth $2.00 or more, quoted between half and double the call's entry price, release exclusions applied. The second, narrower group additionally requires the comparison product's price to have changed on at least as many days as the called card's did over the same 31 days; 61 of the 67 calls retain a group of 30 or more under that rule and the other 6 are reported as unmeasurable against it rather than dropped from the ledger. Percentiles are mid-rank, which matters because ties at exactly 0.00% are common. Medians throughout, never means: the mean 31 day move of the universe is pulled around by a long right tail and would flatter every figure here. PRICE CHANGES. A count of days on which a product's recorded price differed from the previous recorded day, over the 31 days. It is not a liquidity or volume measure. Checked against `market_depth`, the only listing counts we hold, which covers 1,290 usable products on one day, September 7, 2026: the rank correlation with listing counts is -0.169, and repeating it against distinct seller counts points the same way rather than the intuitive one, so no claim about trading is made anywhere in this article. TESTS. Published against held back engine calls: stratified permutation over the nine entry days carrying both groups, 20,000 iterations, on cohort percentile, after requiring seven days held, p = 0.28. Calls beating the narrower group: 32 of 61, two-sided binomial p = 0.80. Prior move against subsequent move: Spearman -0.045 on the 44 calls with a reading 14 days before entry. HORIZONS. Every call in the ledger states a horizon of 12 months or longer and the median one has been held 14 days, so nothing here is a judgement on whether a call was right. This is market research, not financial advice.