

Talk about this hobby borrows a structure from equities, where a single common factor drags most of the tape around with it and a stock's daily move is mostly the index plus a rounding error. The market is hot, the market is cooling, the market rotated into vintage. We finally had enough recorded price history to check whether Pokémon has anything like that factor. It does not. On 741 cards carrying a complete weekly series from September 1, 2025 to August 24, 2026, the average pair of cards moves together with a correlation of 0.026. That is not a weak market factor. That is, to a first approximation, no market factor at all.
What a market factor would look like, and what we found instead
The design is deliberately boring. Take every card where our recorded price tape carries a weekly observation on or before September 1, 2025 and is still being updated in late August 2026, resample each series onto a common Monday grid by carrying the last observed price forward, and keep the ones with a complete 52 point series. That is 2,452 cards. Then gate on the price at the START of the window, not the end, because gating on the end price would quietly select the cards that went up and hand us a triumphant result about a sample we rigged. At a $5 opening price the cohort is 741 cards; at $20 it is 272; at $50 it is 111.
For each card we compute weekly log changes, build an equal-weight index of the cohort, and regress the card on the index with that card REMOVED from the index, which matters more than it sounds: a card is 1/741th of its own benchmark, and leaving it in would manufacture correlation out of arithmetic. Then we measure two things. How much of a card's weekly variance the market explains, and how strongly a randomly chosen pair of cards moves together.
Co-movement at three horizons, same 741 cards
| Return horizon | Periods | Average pairwise correlation | Median R-squared vs index | Cards under 10% R-squared |
|---|---|---|---|---|
| 1 week | 51 | 0.026 | 2.8% | 82.7% |
| 2 weeks | 25 | 0.043 | 6.0% | 63.1% |
| 4 weeks | 12 | 0.068 | 10.8% | 47.8% |
The flat weeks, in both directions
Our price tape does not update every card every week. The median card in this cohort shows no change at all in 23.5% of its weeks; pooled across every card-week in the panel the figure is 30.3%, and the two are different questions with different answers, so both belong in the sentence. Those flat weeks pull the weekly correlation in two directions at once, and an earlier version of this piece disclosed only the direction that helped it.
Pulling DOWN: a week in which a card's quote simply did not refresh contributes a zero to that card's return series regardless of what the underlying card did, which dilutes any genuine common movement. Restricting every pair to the weeks in which BOTH cards actually moved raises the average pairwise correlation from 0.026 to 0.035. Pulling UP: the flat weeks are not scattered independently across cards. They are synchronized, because the feed refreshes on its own schedule and not on each card's. The share of the cohort sitting flat in a given week ranges from 14% to 79%, and the pairwise correlation of the flat/not-flat indicator itself is 0.114, four times the correlation of the returns. Two cards that go flat together and move together produce measured co-movement that has nothing to do with the cards. The net of the two effects is the 0.009 gap above, so 0.026 remains a mild underestimate, but calling it a clean lower bound, as we did, was only half the arithmetic. The four-week horizon, where quotes have time to catch up, is the more reliable read: it triples the correlation to 0.068, and triple almost nothing is still almost nothing.
The index nobody could have traded
Now the part that sounds like a contradiction. Average those 741 near-independent cards into an equal-weight index and it climbs 41.0% over the year, with only four negative weeks in fifty-one. Its best week was plus 1.99%, ending June 1, 2026. Its worst was minus 0.30%, ending February 2, 2026. An index with a 41% annual return and a worst week of minus a third of a percent is not a description of a calm market. It is what happens when you average hundreds of series whose wiggles cancel because they are unrelated to each other. The smoothness IS the near-zero correlation, viewed from the other end.
Equal-weight index of the 741 card cohort, twelve roughly monthly points across the grid
Notice where the year actually happened. The index gained 10.34 points across the five months from the first plotted week to the February one, and then 28.90 points from February to August. A single common drift, slow and one directional, is consistent with everything above: a factor that moves a percent a month is invisible inside weekly noise and unmistakable across a year. Whatever it is, it is not something a weekly chart of any individual card would have shown you.
The spread is the whole game
One-year returns across the 741 cards, September 1 2025 to August 24 2026
| Percentile | 52-week return |
|---|---|
| 5th | -20.7% |
| 10th | -7.0% |
| 25th | +10.1% |
| Median | +38.0% |
| 75th | +78.3% |
| 90th | +132.3% |
| 95th | +176.7% |
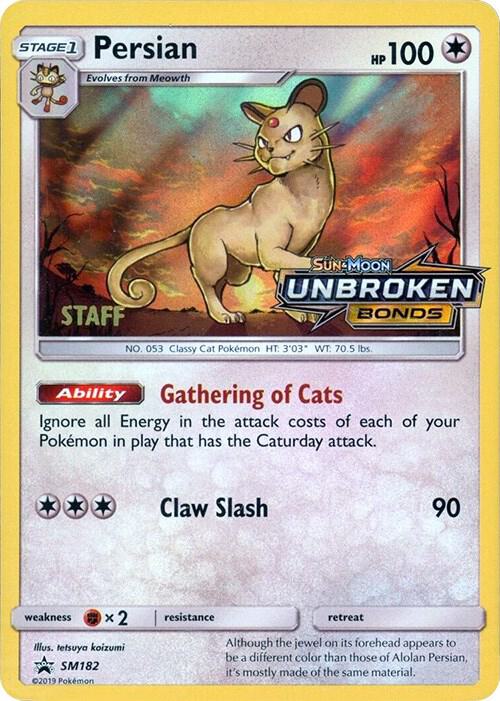
The gap between the 25th and 75th percentile is 68 points of return in a single year, on cards that all started above $5 and all sat in the same hobby, the same currency, and the same distribution channel. The extremes are wider still. Persian, an SM-era promo, went from $26.41 to $300.00. Electrode from Team Up went from $8.63 to $45.08. At the other end, the losers have to be described carefully, because nine of the ten worst performers in this cohort do not resolve to a named card in our catalog at all: they are TCGplayer product ids whose series we hold and whose identity we do not. Among the losers we CAN name, a cluster of expired format staples stands out: Counter Catcher from Crimson Invasion at minus 49.1%, Counter Gain from Lost Thunder at minus 48.3%, Field Blower from Guardians Rising at minus 43.2%, and Max Potion from the same set at minus 29.5%. Card selection did not matter a little more than market timing here. Market timing had essentially nothing to time.
Even the most market-driven cards we could find are barely market-driven. Mew VMAX from Fusion Strike has the highest R-squared in the cohort at 40.8%, with a beta of 5.14 against the index, meaning it swings five times as hard as the average card in the weeks it moves at all. Galarian Articuno V from Chilling Reign comes second at 39.4%. Those are the two most connected cards out of 741, and a majority of their variance is still their own.
Momentum exists in the cheap end, and only there
We split the year at March 2, 2026 and asked whether the first half predicted the second. Across the 741, the correlation between first-half and second-half log returns is 0.219, which is real and useful. Sorted into quintiles by first-half return, the pattern is monotone in the direction momentum traders would expect. Run the identical test on the 111 cards that opened above $50 and the correlation is minus 0.003. The momentum lives entirely in the cheap end of the cohort, where a card moving from $6 to $9 is a rounding error in dollars and a 50% return in percentages, and where a rising price tends to reflect a thinning listing pool that keeps thinning. The quintile table below does not describe $500 cards.
Sort by first-half return, then look at what happened next
| Quintile | Cards | Sept to Feb median | March to Aug median |
|---|---|---|---|
| 1 (worst) | 148 | -14.3% | +10.8% |
| 2 | 148 | -0.1% | +14.8% |
| 3 | 148 | +9.3% | +24.3% |
| 4 | 148 | +23.9% | +25.4% |
| 5 (best) | 149 | +52.7% | +30.7% |
Every quintile is positive in the second half, including the losers, which is the common drift showing up again.
The set-level view says the same thing in a different accent. Fifteen sets carry at least 15 cards in the cohort, and their median one-year returns run from 4.1% to 83.2%. Nine of those fifteen, in rank order, with six omitted for length rather than because they sit at the bottom: the SM-era promo group leads at 83.2% on 116 cards, then Shining Legends at 59.1% on 15, Celestial Storm 52.7% on 38, Lost Thunder 40.8% on 48, Chilling Reign 36.0% on 49, Team Up 30.2% on 39 with every single card up, Ultra Prism 26.6% on 41, Fusion Strike 20.4% on 19, and Evolutions, the 2016 XY set, lowest of the fifteen at 4.1% on 19. Even that spread, across fifteen sets, is smaller than the spread WITHIN any one of them. The set is not the unit of analysis either. The card is.
Everything here is measured on quotes rather than sales, and how often those quotes refresh is itself the subject of The Frozen Tape.
Source: the moonstone price-history cache, read September 2, 2026, holding provider weekly market-price series for 7,039 TCGplayer products with points as recent as August 31, 2026. Panel construction: a common Monday grid of 52 dates from September 1, 2025 to August 24, 2026; each series resampled by carrying the last observation at or before each grid date forward; a card qualifies only if it has an observation on or before the first grid date and a final observation on or after August 10, 2026, giving 2,452 complete series. Cohorts are gated on the price at the FIRST grid date, never the last, to avoid selecting winners. Returns are natural log changes. The index is the equal-weight mean of cohort log returns each week, compounded; per-card R-squared and beta come from an ordinary least squares fit against a LEAVE-ONE-OUT index, so a card never appears in its own benchmark. Average pairwise correlation is computed over every second card in the cohort (371 of 741, 68,635 pairs) for tractability, on standardized return vectors. The bar chart plots twelve grid weeks spaced about four and a half weeks apart, one falling in each month of the window, and labels each bar with the month that week falls in; those are not first Mondays, and the corresponding first-Monday series runs 100.00, 106.46, 107.87, 108.61, 109.27, 109.00, 111.93, 116.64, 121.54, 128.73, 134.98, 139.24 for anyone who wants it. Known biases, stated rather than buried: these are TCGplayer market prices for the flagship printing of each product, which are derived from asks and update on their own cadence; the median card is flat in 23.5% of its weeks and 30.3% of all card-weeks are flat; flat weeks bias measured correlation DOWN by diluting real co-movement and UP because they are synchronized across cards (pairwise correlation of the flat indicator is 0.114), and the net measured effect is that restricting to weeks where both cards moved raises the average pairwise correlation from 0.026 to 0.035. The four-week figures are the more conservative read and they are also small. The cohort is not the market. It is skewed toward SM and SWSH-era secondary product because that is where our history cache is deepest, it contains no vintage and little current-year chase product, and 186 of the 741 do not resolve to a named card in our catalog, so they are counted but not nameable, including nine of the ten worst performers. No significance tests are reported and none are implied. Not financial advice.