Sum the market price of every card we price on 2026-09-22 and the total is $739,142.50 across 44,395 cards. Half of that sits in 952 of them, which is 2.14% of the PRICED catalogue, and the priced catalogue is 44,395 of the 63,600 rows we hold, so every share in this study is a share of what we price rather than of what exists. That is the value concentration, and it is the number most people mean when they ask how top-heavy this market is. The more useful number is the other one. Over the 23 days to 2026-09-22 the ten largest dollar movers accounted for 17.32% of all the price movement in the entire market, and the concentration of MOVEMENT is measurably tighter than the concentration of value: a Gini of 0.9627 against 0.8677.
Where the money actually sits, counted across the whole priced catalogue
An earlier piece on this site, Where the Money Sleeps, measured this across 5,723 English cards in August 2026 and found the top 1% holding 45.4% of value. That number was right for that sample and it is the wrong number for the market, because the sample was the subset our daily sync then reached. The sync now reaches 44,395 priced cards, roughly eight times as many, and adding the rest of the catalogue moves the top-1% share down to 35.97%. The direction of the correction is the lesson: a concentration figure is mostly a statement about how much of the long tail you bothered to count.
Share of total market value held by the top slice, 44,395 cards, 2026-09-22
| Slice | Cards | Share of value | Dollars | Cheapest card in the slice |
|---|---|---|---|---|
| top 0.1% | 44 | 10.75% | $79,451 | $1,066.19 |
| top 0.5% | 222 | 25.70% | $189,937 | $437.87 |
| top 1% | 444 | 35.97% | $265,874 | $279.90 |
| top 2% | 888 | 48.65% | $359,614 | $163.21 |
| top 5% | 2,220 | 67.03% | $495,410 | $68.07 |
| top 10% | 4,440 | 80.20% | $592,822 | $29.64 |
| top 25% | 11,099 | 93.34% | $689,924 | $6.99 |
| top 50% | 22,198 | 98.66% | $729,214 | $1.50 |
The distribution matters more than the ranking. The median priced card is worth $1.50 and the mean is $16.65, a ratio of eleven to one that tells you the whole story before any table does. 8,362 cards, 18.84% of the priced catalogue, hold 90% of the value. Below that line the market is enormous and weightless: 43.65% of priced cards are worth less than a dollar, and together they are 0.88% of the money.
The priced catalogue by price band, 2026-09-22
| Price band | Cards | Share of cards | Total value | Share of value |
|---|---|---|---|---|
| under $0.25 | 9,386 | 21.14% | $1,346 | 0.18% |
| $0.25 to $1 | 9,994 | 22.51% | $5,173 | 0.70% |
| $1 to $5 | 11,571 | 26.06% | $29,209 | 3.95% |
| $5 to $25 | 8,439 | 19.01% | $95,398 | 12.91% |
| $25 to $100 | 3,535 | 7.96% | $174,285 | 23.58% |
| $100 to $500 | 1,300 | 2.93% | $268,270 | 36.29% |
| $500 to $2,500 | 163 | 0.37% | $140,549 | 19.02% |
| $2,500 and up | 7 | 0.02% | $24,910 | 3.37% |
The number nobody publishes: how few cards produce the market's price action
Value concentration is a snapshot. Movement concentration is what actually determines whether an index, a portfolio or a market report is describing the market or describing a handful of cards. We built a panel of the 43,800 products priced on both 2026-08-30 and 2026-09-22, so that no card entering or leaving the tape can contribute a dollar of change, and summed the absolute dollar move of each one. 595 products entered the tape inside the window and 299 left it; both groups are excluded from every movement figure below.
Share of all absolute dollar movement, by the largest movers, 43,800-card panel, 23 days
| Movers | Share of the panel | Share of all dollar movement |
|---|---|---|
| top 10 | 0.023% | 17.32% |
| top 50 | 0.114% | 34.83% |
| top 100 | 0.228% | 45.04% |
| top 250 | 0.571% | 60.55% |
| top 500 | 1.142% | 72.15% |
| top 1,000 | 2.283% | 81.74% |
| top 2,500 | 5.708% | 91.39% |
| top 5,000 | 11.416% | 96.21% |
One hundred cards out of 43,800 carried 45.04% of every dollar of price change in the market over those three weeks. A thousand carried 81.74%. This is not the same fact as value concentration restated: of the 500 largest dollar movers, only 138 sit in the most expensive 1% of the panel ranked by its price on the FIRST day, so the movement is not simply the big cards being big. Ranking that same 1% by the last day's price instead gives 135, and the convention is stated because the two readings differ. The Gini coefficient makes the comparison directly. Card value scores 0.8677 and absolute dollar movement scores 0.9627 on the same panel on the same day.
The ten largest dollar moves, 2026-08-30 to 2026-09-22
| Card | Set | 2026-08-30 | 2026-09-22 | Change | Percent |
|---|---|---|---|---|---|
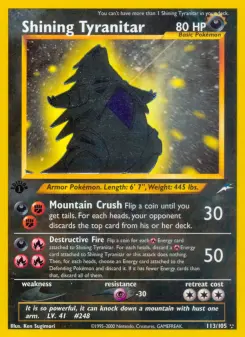
| Shining Tyranitar | Neo Destiny | $4,249.99 | $662.25 | -$3,587.74 | -84.42% |
| Shining Mewtwo | Neo Destiny | $3,000.00 | $940.00 | -$2,060.00 | -68.67% |
| Shining Celebi | Neo Destiny | $1,801.00 | $435.00 | -$1,366.00 | -75.85% |
| Jolteon ☆ | Power Keepers | $1,999.94 | $750.00 | -$1,249.94 | -62.50% |
| Shining Kabutops | Neo Destiny | $1,399.95 | $382.44 | -$1,017.51 | -72.68% |
| Mewtwo ex | 30th Celebration | $1,000.00 | $83.53 | -$916.47 | -91.65% |
| Rayquaza ex | Deoxys | $999.00 | $129.00 | -$870.00 | -87.09% |
| Rayquaza - 232/XY-P | XY-P: XY Promos | $497.49 | $1,299.99 | +$802.50 | +161.31% |
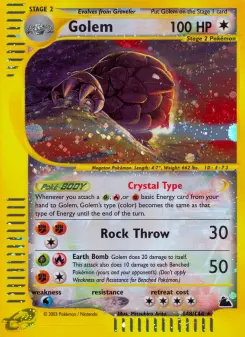
| Golem | Skyridge | $599.99 | $1,387.99 | +$788.00 | +131.34% |
| Umbreon | Neo Discovery | $1,500.00 | $752.74 | -$747.26 | -49.82% |
One more figure from the same panel, because it is the context for all of the above. Over the 23 days, 36.29% of the panel moved up, 28.98% moved down, and 34.73% did not change by a cent. Gross dollars gained came to $31,685 and gross dollars lost to $45,734, for a net of -$14,049 on a panel worth $747,613 at the start. The market's aggregate price-weighted change was -1.88% while the mean card rose 4.06% and the median card returned exactly 0.00%. Those three numbers describe the same three weeks and they are the subject of Four Ways to Index the Same Pokemon Cards.
As of 2026-09-22. Value concentration is a single-day cross-section of `price_history` on day 20718, every TCGplayer product carrying a positive price that day, n = 44,395 after joining `cards` on `tcg_id`; prices are the flagship-printing TCGplayer market price, an ASK. Every panel is keyed on the TCGplayer product id and carries exactly one row per product. 51,719 catalogue rows carry a TCGplayer product id, and they resolve to 50,507 distinct ids: 1,212 ids are claimed by two rows each, 2,424 rows in all. Those pairs are not a Japanese print against its English twin, which is what we assumed before counting them. Every one of the 1,212 is a same-language pair, 972 Japanese and 240 English, and they are overwhelmingly one product indexed under two catalogue spellings of the same set, as the XY trainer kits are. Each id collapses to a single row, preferring an English row and then the lexically first catalogue id, so no product enters a cross-section, a factor sort or a census twice. The tie-break is stated rather than assumed away, because it decides which of the two spellings a shared product is filed under. Shares are straight sums over that population with no weighting and no modelling; the Gini coefficient is computed on the raw price vector. Slice sizes are rounded to the nearest card, so the top 1% is 444 cards rather than 443.95. Movement concentration uses a separate panel: the 43,800 products carrying a price on BOTH day 20695 (2026-08-30) and day 20718, so that the 595 entrants and 299 exits inside the window contribute nothing to any change figure. Absolute movement is the sum of |price on 20718 minus price on 20695| over that panel; the movement Gini is computed on that vector of absolute changes. The 1.88% aggregate change is the sum of levels on the last day divided by the sum of levels on the first, which is a price-weighted reading and is labelled as such. Days 20704 to 20713 are partial dumps covering 35,700 to 50,400 products rather than the full catalogue; no figure in this study depends on those days, because every figure uses either the last day alone or the two endpoints, and both of those days are full dumps. That was checked rather than assumed, because a partial evaluation day drops cheap cards first and would tilt every share in this study toward the expensive end: day 20718 carries 52,309 priced products, the highest count anywhere in the window, and day 20695 carries 51,822. The median convention is the upper-middle element on even samples. No price floor, no top-N window, no rarity or language exclusion: the universe is the catalogue as priced.