
The Float counted the shelf once, on 15 September: 1.1 million listings across the cards we track, a $17.5 million shelf price, and no direction, because one reading is a level. We now hold 36 recorded days of the same provider field. Across the 9,692 cards readable at both ends of the window, the median card's active TCGplayer listing count rose 4.61% and the shelf those cards sit on grew by 52,163 listings. It rose on 5,951 of them, fell on 2,935 and held on 806. That is the whole of what is new here, and it is the opposite of what the supply argument assumes.
The float index, 15 September to 11 October
A staircase, not a line
The flat start is not a flat market. The provider refreshes this count on its own schedule, we write down whatever it says when the cron looks, and the result is a staircase per card. Across the 2,702 unchanged stretches on 348 traced cards, the median stretch runs two recorded days and the mean 2.9, and the longest stretch in the four cards below is twelve days. Counted from the other end, across the 16 one-day steps in the window where both days are readable, a median 25.0% of the cards we see carry a different number than the day before. The low step is 8.5% and the high is 48.5%. Three cards in four repeat yesterday's number on a typical day, which is why the median card in the chart sits at exactly its base for the first week. It also explains why the chart ends at +4.85% and the headline says +4.61%: the chart's last point is one day on 8,172 cards, the headline a three-day block on 9,692. Window scale change is supportable here. Dating a change to a day is not.
Four cards, four cadences, same window
| Card | Set | Days recorded | Distinct values | Changes | Longest unchanged run |
|---|---|---|---|---|---|
| Mega Sharpedo ex 061 | Phantasmal Flames | 22 | 2 | 1 | 12 recorded days at 1,617 |
| Terapagos ex 128 | Stellar Crown | 21 | 3 | 2 | 11 recorded days at 823 |
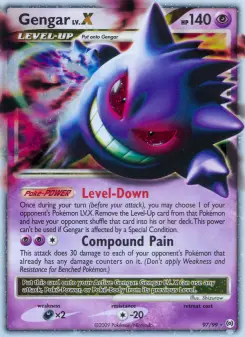
| Gengar LV.X 97 | Arceus | 21 | 10 | 11 | 4 recorded days |
| Alakazam 1 | Base Set | 30 | 16 | 18 | 2 recorded days |
There are two holes in the window and both make the answer softer. The left edge is 15 September because that is where daily coverage starts, and that file carries readings of an age we cannot pin: of seven cards traced by hand, three show a value they already carried a week earlier, two repeat their 14 September number and two show a figure that appears for the first time. The crowd reading agrees that the base is stale: 48.5% of the 10,376 cards present on both days changed between 15 and 16 September, against 17.4% the day after. Treat the base as up to a week old and the 26 days as 26 to 33. The second hole runs 24 September to 2 October, when the cron wrote between 1,678 and 9,040 cards a day against 12,252 on 23 September and 10,387 on 3 October, so the chart steps from day 8 to day 18 with nothing readable in between.
It is two dozen cards, not a market
Where the 26 day change landed
Everything that lost anything at all is 29.1% of that group, 1,921 cards of 6,609, and most of those lost under a tenth of their shelf. The real drain is the first bar. Two populations appear in this note for the same cut, 6,592 and 6,609, and the reason is that 12 October was still being written when the panel was first cut and kept filling while we worked. The first read gave 9,692 paired cards, a median of +4.61% and 22 cards down half or more. The rerun, read after that day's last write at 21:00 UTC, gave 9,726, +4.59% and 23. We print both rather than pick one, and we say which is which: the deck, the lede and the stat row are the first read, while the chart above and the two ranked tables below are the rerun, because the rerun is the read a later pull reproduces.
The ten biggest percentage fallers, of the 6,609 above the twenty-listing floor on the rerun read
| Card | Set | 15 to 17 Sep | 10 to 12 Oct | Change |
|---|---|---|---|---|
| Gengar LV.X 97 | Arceus | 27.0 | 4.0 | -85.2% |
| Jirachi Prism Star 97 | Celestial Storm | 57.7 | 13.7 | -76.3% |
| Celebi Prism Star 19 | Lost Thunder | 118.7 | 31.7 | -73.3% |
| Giratina Prism Star 58 | Ultra Prism | 64.0 | 19.7 | -69.3% |
| Latios Prism Star 108 | Celestial Storm | 81.7 | 25.7 | -68.6% |
| Bulbasaur, Pokemon Day 2026 001/132 | Miscellaneous Cards & Products | 64.3 | 22.0 | -65.8% |
| Nihilego-GX SV62 | Hidden Fates Shiny Vault | 35.7 | 12.3 | -65.4% |
| Darkrai BW73 | BW Black Star Promos | 34.7 | 12.3 | -64.4% |
| Victini Prism Star 7 | Dragon Majesty | 79.0 | 28.7 | -63.7% |
| Gothitelle 123/086 | SV11W: White Flare (Japanese) | 22.0 | 8.0 | -63.6% |
Of the 6,609 cards above the floor on the rerun read, seven of the fifteen biggest fallers are Sun and Moon era Prism Star cards. Five of the seven are in the table above; the other two are Xerneas Prism Star at -61.0% and Ditto Prism Star at -60.5%, twelfth and fourteenth. The cluster falls between 60.5% and 76.3%, and each card gets there in four to twelve separate downward steps rather than one. We do not know why, and we are not going to supply a reason we cannot test: our own card pages read the same provider field this table reads, so there is no second copy of the number inside our stack to check the cluster against. The cards that lost the most listings in absolute terms are mostly a different animal, though three of the ten biggest absolute fallers are Prism Stars from that same cluster. Mega Kangaskhan ex from Mega Evolution gave up 106.7 listings from a shelf of 849.7, 12.6% of it, and that is the largest absolute fall of the 9,726 paired cards. The Mega Sharpedo in the table above is second, 101 listings off 1,617. Of the seven in that top ten that are not Prism Stars, Lugia V from the SWSH Black Star Promos fell hardest in percentage terms, and its daily series reads like a drain rather than a drift: 161 listings on 4 October, 75 on 10 October.
The four weakest and four strongest of the 133 sets with 25 or more paired cards, by median per-card float change on the rerun read
| Set | Median change | Paired cards |
|---|---|---|
| Call of Legends | -16.6% | 38 |
| Trading Card Game Classic | -11.4% | 36 |
| HeartGold SoulSilver | -7.7% | 25 |
| Pokemon VS (Japanese) | -7.1% | 25 |
| S8b: VMAX Climax (Japanese) | +17.6% | 59 |
| S12a: VSTAR Universe (Japanese) | +16.4% | 63 |
| Generations | +15.3% | 45 |
| White Flare | +13.1% | 98 |
Those paired-card counts are a lower bound, not a census. cards.set_id is empty on 69,034 of our 69,894 catalog rows, so a set here is a language plus a set name rather than a key, and the 230 products claimed by two catalog rows with different set names were collapsed onto the row carrying the romanised name. None of those 230 straddle two languages, and all eight cells above are identical whichever of the two rows we keep. A set's real paired count can only be the same or larger. With 25 to 98 cards behind a cell the median is one or two cards, so read the two weakest rows as a direction and not as a magnitude. The card level rankings do not depend on any of that.
The cards with no shelf at all
On 11 October, a complete day of 109,361 rows covering 14,781 cards, 731 of those cards had zero active listings. Of the 715 with five or more recorded days, 487 were at zero on every day we have ever recorded them, and 95 were at zero on fewer than half of theirs. Those are two different cards wearing the same number: one has never had a shelf, the other just sold out of one. The whole day sums to 1,296,185 listings, a median of 34 per card, tenth percentile 2 and ninetieth 228. That median sits far below the 95 in The Float, and the two are different populations rather than a change: that cut was 6,527 English cards, this day is 14,781 products including Japanese ones.
Priced, and almost nothing for sale. Readings on 2026-10-11
| Card | Set | Listings | Days at zero | Raw quote | PSA 10 model | Last dated PSA 10 sale |
|---|---|---|---|---|---|---|
| Trade Please! 282/XY-P | XY-P: XY Promos | 0 | 21 of 21 recorded | $300.00 Near Mint | $499.00 on 26 comps | 10 Oct, $499.00 |
| Reshiram 022/020 | Shiny Collection | 0 | 21 of 21 | $300.00 Near Mint | $2,800.51 on 38 comps | 7 Oct, $2,950.01 |
| Leafeon LV.X | DP4: Dawn Dash | 0 | 11 of 21 | $200.00 Near Mint | $3,830.00 on 94 comps | 8 Oct, $5,600.00 |
| Gengar VMAX 157/264 | Prize Pack Series Cards | 0 | 5 of 5 | $1,499.99 Near Mint | no PSA 10 row that day | none in the feed |
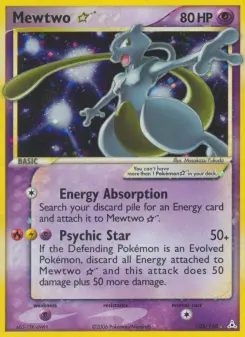
| Mewtwo Star 103 | Holon Phantoms | 3 | 0 of 16 | no Near Mint quote | $81,500 on 8 comps | 17 Feb, 236 days |
| Pikachu 7 | Pokémon Rumble | 2 | 0 of 21 | $899.99 Near Mint | $46,400 on 4 comps | 3 Jun, 130 days |
| Metagross Star 113 | Delta Species | 3 | 0 of 21 | no Near Mint quote | $45,600 on 4 comps | 29 Jun, 104 days |
Active listings against PSA 10 sale recency, 9,667 cards with a PSA 10 row on 2026-10-11
| Listings | Cards | Sold in last 7 days | 8 to 30 days | 31 to 90 days | 91 days or more | No dated sale in the feed |
|---|---|---|---|---|---|---|
| 0 | 487 | 116 (24.5%) | 164 | 134 | 60 | 13 |
| 1 to 4 | 1,466 | 297 (20.7%) | 604 | 358 | 173 | 34 |
| 5 to 19 | 1,870 | 470 (25.4%) | 732 | 426 | 223 | 19 |
| 20 to 99 | 2,929 | 786 (27.2%) | 1,070 | 663 | 370 | 40 |
| 100 or more | 2,915 | 734 (26.1%) | 977 | 810 | 292 | 102 |
The percentage in that third column is of the cards in its row that have a dated sale at all, and it barely moves: 24.5% of the empty-shelf cards had a PSA 10 sale inside the previous week, against 27.2% of the cards sitting on 20 to 99 listings. An empty raw shelf is not a dead card and a deep one is not a busy card. It helps to remember these are two different objects: the listing count is raw listings of a TCGplayer product, the sale is a slab, so zero listings and a sale yesterday is not a contradiction but a card whose supply lives in graded form. The last column is not a zero either. 208 of the 9,667 PSA 10 rows that day carry no dated sale because the provider gave us its own aggregate and no comps, 102 of them in the deepest float bucket. Those cards are unmeasured, not slow.
What this measure is not
The field is one number per TCGplayer product id, covering every condition and printing of that product at once. It is not a Near Mint count and it is not a graded float, so it cannot be read as copies of this slab for sale and it cannot be divided into a PSA population to get a ratio that means anything. It is also called listings, and we have not established whether a listing carrying a quantity above one counts once or many times, so read it as listings and treat the copy count as at least this and possibly more.
Nothing on the site shows this history. A card page prints the listing count beside the price, which is the same provider field this note reads, and you can check that one number against the TCGplayer product page in a minute. The 26 day change has no surface at all. Every ranked figure above is uncheckable by a reader until we ship a float chart on the card page or a board that ranks the fallers, and until we close that gap the figures above rest on our word.
graded_snapshots on production Turso, read on 2026-10-12, reading the listings column, which is the active TCGplayer listing count that rides the same provider call as the graded snapshot. listings is non-null from 2026-08-29 and usable daily coverage starts 2026-09-15, giving 36 recorded days. Only numeric TCGplayer product keys are kept: the table holds two keyspaces and the catalog-id keys are the stale one, 17 of 11,901 on 12 October and none at all on 10 or 11 October, all dropped, and no join mixed them. listings repeats on every grade row of a card's day, so each day is collapsed with MAX(listings) GROUP BY card_key; on 11 October, 0 of 14,781 cards had grade rows that disagreed. Change panel: three-day blocks 2026-09-15 to 17 against 2026-10-10 to 12, each card paired to itself, two or more days present in each block. Universe across both blocks 15,647, of which 5,213 were excluded for fewer than two early days and 708 more for fewer than two late days, leaving 9,726 paired on the rerun read (15,646, 5,212, 742 and 9,692 on the first); cards present in only one block were dropped rather than aggregated, because a basket that changes membership is not a measurement. Each band takes its lower edge: a card down exactly 10% is in the 10% to 25% band and one down exactly 25% is in the 25% to 50% band, which is why the first two bars sum to the 151 cards down a quarter or more. Thirty one cards sit exactly on an edge, 15 of them on the 10% edge, 14 on the 25% edge and 2 on the 50% edge, and in floating point some of them land either side of it, so the bands are computed in exact arithmetic. The percentage ranking is floored at a start-block average of 20 listings, keeping 6,609 and excluding 3,117 on the rerun read (6,592 and 3,100 on the first), and the absolute ranking is reported separately. The deck, the lede and the stat row carry the first read; the distribution chart, the fallers table and the set table carry the rerun, which a later pull reproduces exactly. The day buckets, the zero cohort and the sale-recency table are not panel reads at all. 12 October was still being written when the panel was cut, 93,831 rows against 109,361 on 11 October, and it held 98,817 rows at the rerun; the rerun gives 9,726 paired, median +4.59%, 6,609 above the floor, 23 down half or more and 151 down a quarter or more; both reads are printed above. The chart is a fixed panel of the 8,172 paired cards present on all twelve plotted days, each indexed to its own 15 to 17 September average, and the plotted days are 15, 17, 19, 21, 22 and 23 September and 3, 4, 6, 8, 10 and 11 October. No plotted day is 12 October, and all twelve values come out the same on both reads, so the line chart does not move between them. Day buckets, the zero cohort and the sale-recency table are read on 2026-10-11, a complete day of 109,361 rows and 14,781 cards, and the 9,667 figure is the numeric-key cards with a PSA 10 row that day. Set grouping is keyed on language plus set name because cards.set_id is empty on 69,034 of 69,894 catalog rows, and the 230 products claimed by two catalog rows with differing set names were collapsed onto the row carrying the romanised name, so a set's paired count is a lower bound; 133 groups reach 25 paired cards. Two of the set labels are ours and not the catalog's: the 63 cards we print as S12a: VSTAR Universe carry only the Japanese name in our catalog, and SV11W: White Flare is a separate Japanese group from the English White Flare, which is why both appear. Prices are Near Mint quotes from nm_history on 2026-10-11 and the provider's PSA 10 model from the same day with its comp count printed; an absent dated sale is recorded as absent and never as a zero. Cadence figures come from a 348-card trace, a fixed stride through the paired panel read over every recorded day each card has, and from the 16 one-day steps inside the window where both days are readable, which excludes 12 October as a step endpoint because it was still filling. An unchanged stretch is a run of consecutive recorded days carrying one value, and a downward step is a recorded day lower than the recorded day before it, counted over each card's own series; for the Prism Star cluster those series run 18 to 30 days. Every read is an indexed day read or an exact-key read; no api_cache read, no prefix predicate and no table scan. Not financial advice.