An index is a level. Breadth is a headcount: of all the cards, how many rose, how many fell, how many sat still. Equity markets watch it because a rally carried by a few names is a different animal from one carried by most of them. Until this month we could not compute it, because our price history was bought set by set; since late August a canonical price for every catalog card has been written daily. Sixteen days is a short window, and we say so below, but it is the first one, and the answer it gives is already different from the one the index gives. The August state of the market was written from the index. This is written from the cards.
Broad, cheap, and vintage
Breadth by price tier, English cards, cheapest printing, 2026-08-29 to 2026-09-14 (flat = within 2%)
| Price at start | Cards | Up | Down | Flat | Mean change | Value-weighted change |
|---|---|---|---|---|---|---|
| Under $1 | 10,554 | 39.9% | 30.8% | 29.3% | +1.8% | +1.6% |
| $1 to $5 | 4,122 | 38.9% | 23.1% | 38.0% | +1.3% | +1.3% |
| $5 to $25 | 3,569 | 36.0% | 21.6% | 42.4% | +0.9% | +1.0% |
| $25 to $100 | 1,704 | 31.6% | 15.9% | 52.5% | +1.3% | +1.4% |
| $100 to $500 | 837 | 26.5% | 10.2% | 63.3% | +1.8% | +1.7% |
| $500 and up | 129 | 15.5% | 8.5% | 76.0% | +1.1% | +1.2% |
| All English | 20,915 | 37.7% | 25.5% | 36.8% | +1.5% | +1.4% |
| Top 300 by price | 300 | 19.0% | 7.7% | 73.3% | +1.0% | +1.1% |
Three of every eight English cards rose and one in four fell, for a mean change of +1.5% and a value-weighted change of +1.4%. The index, a frozen basket of fifty blue-chip cards, rose 4.8% over the same days, so the leaders that make up the index did better than the market did; but the market's top 300 by price, a wider cut of the same tier, were 73% flat. Both can be true: an index of fifty cards can move on a handful of them. The pattern down the tiers is monotonic. The cheaper the card, the more likely it moved at all, in either direction, and the sub-dollar tier had both the most risers (39.9%) and the most fallers (30.8%), which The Drawdown Book found over eighteen months too: cheap cards are where the volatility lives, and most of it is noise.
Breadth by era, English cards
| Era | Cards | Up | Down | Flat | Median change | Value-weighted change |
|---|---|---|---|---|---|---|
| WotC | 1,778 | 40.3% | 12.3% | 47.4% | +1.0% | +1.8% |
| HeartGold SoulSilver | 542 | 39.5% | 12.9% | 47.6% | +0.7% | +5.0% |
| Diamond & Pearl | 1,413 | 38.6% | 12.1% | 49.3% | +0.5% | +3.5% |
| EX era | 1,862 | 31.8% | 10.4% | 57.8% | 0.0% | +1.2% |
| Black & White | 1,379 | 30.7% | 16.5% | 52.8% | 0.0% | +2.2% |
| XY | 1,746 | 37.7% | 20.2% | 42.0% | 0.0% | +1.9% |
| Sun & Moon | 2,873 | 38.6% | 22.7% | 38.7% | +0.2% | +2.4% |
| Sword & Shield | 3,526 | 40.2% | 37.8% | 22.0% | 0.0% | -0.5% |
| Scarlet & Violet | 3,511 | 42.6% | 37.7% | 19.7% | 0.0% | -1.4% |
| Mega Evolution | 995 | 35.4% | 50.9% | 13.8% | -2.7% | -5.8% |
The era table is the story. Vintage rose almost without fallers: WotC cards rose 40.3% to 12.3%, HeartGold SoulSilver 39.5% to 12.9%, Diamond & Pearl 38.6% to 12.1%, and every era printed before 2020 had a positive value-weighted change. The two current eras were split down the middle, Sword & Shield 40.2% up to 37.8% down and Scarlet & Violet 42.6% to 37.7%, with slightly negative value-weighted changes. And the newest era fell: 50.9% of Mega Evolution cards dropped more than 2%, the median card lost 2.7%, and the value-weighted change was -5.8%. That is the launch curve doing what it does, a set repricing downward from its opening print as supply arrives, and it is happening while the rest of the market rises.
151 rose two to one; Journey Together fell two to one
Sets with the most risers and the most fallers, English sets with 30+ priced cards
| Set | Cards | Up | Down | Median change | Value-weighted |
|---|---|---|---|---|---|
| 151 | 199 | 62.8% | 21.1% | +6.0% | +0.2% |
| DP Black Star Promos | 52 | 59.6% | 1.9% | +2.8% | +4.2% |
| Wizards Black Star Promos | 51 | 54.9% | 9.8% | +2.0% | +6.1% |
| Champion's Path | 79 | 54.4% | 27.8% | +4.3% | -0.3% |
| Evolutions | 108 | 53.7% | 27.8% | +2.9% | +1.7% |
| Base Set | 100 | 53.0% | 29.0% | +4.4% | +0.7% |
| Obsidian Flames | 227 | 52.9% | 29.1% | +3.4% | -1.9% |
| Paradox Rift | 254 | 52.8% | 26.4% | +3.5% | 0.0% |
| Journey Together | 185 | 31.4% | 59.5% | -6.2% | -4.1% |
| MEP Black Star Promos | 76 | 25.0% | 56.6% | -5.2% | -4.5% |
| Mega Evolution | 183 | 31.7% | 56.3% | -5.4% | -3.9% |
| Ascended Heroes | 287 | 31.0% | 53.0% | -3.2% | -7.0% |
| Black Bolt | 171 | 26.3% | 52.6% | -2.5% | -1.4% |
| ME05: Pitch Black | 95 | 38.9% | 52.6% | -5.9% | -16.3% |
Of 156 sets with thirty or more priced cards, 120 had more risers than fallers. The risers' list is led by 151, where 62.8% of cards rose and the median card gained 6.0%, though its value-weighted change was +0.2% because the expensive cards sat still; then the two oldest promo sets and Base Set itself, up 53% to 29%. The fallers' list is the current product line almost without exception: Journey Together, the MEP promos, Mega Evolution, Ascended Heroes at -7.0% value-weighted, and ME05: Pitch Black, the newest set on the list, at -16.3% value-weighted. The Launch Curve measured this decay one set at a time; here it is happening to five sets at once.
The biggest sixteen-day moves above $25 were nearly all vintage
Largest gains and losses, English cards priced $25 or more at the start, cheapest printing
| Card | Set | Aug 29 | Sep 14 | Change |
|---|---|---|---|---|
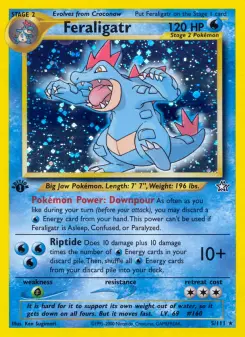
| Feraligatr | Neo Genesis | $118.32 | $182.59 | +54.3% |
| Lanturn | Aquapolis H15 | $64.98 | $100.00 | +53.9% |
| Meowth | Skyridge | $84.99 | $129.99 | +52.9% |
| Scizor ex | Unseen Forces | $119.85 | $182.94 | +52.6% |
| Kingdra | Neo Genesis | $82.50 | $124.00 | +50.3% |
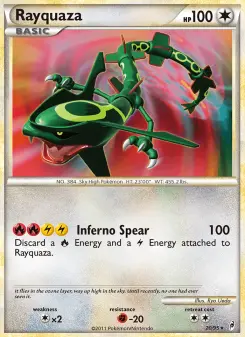
| Rayquaza | Call of Legends | $679.27 | $1,013.27 | +49.2% |
| Espeon | Undaunted | $241.56 | $360.30 | +49.2% |
| Dark Blastoise | Legendary Collection | $145.99 | $213.49 | +46.2% |
| Light Azumarill | Neo Destiny | $151.48 | $62.49 | -58.7% |
| Rayquaza | Emerald | $112.06 | $49.99 | -55.4% |
| Dark Houndoom | Team Rocket Returns | $93.37 | $50.00 | -46.4% |
| Hitmontop | Neo Discovery | $300.00 | $161.45 | -46.2% |
| Entei ex | Team Magma vs Team Aqua | $277.24 | $175.00 | -36.9% |
| Charizard | Dragon | $739.97 | $489.99 | -33.8% |
Both ends of the movers list are vintage, which is what thin shelves do: The Float found that cards above $100 sit on a median of 26 listings, and a card on 26 listings moves 50% when two of them sell. The Call of Legends Rayquaza is the one four-figure card on the gainers' side, $679 to $1,013; the Dragon Charizard is the one on the losers' side, $740 to $490. We excluded 531 cards whose cheapest printing moved 60% or more in the window as relists or data faults rather than prices, the same rule the movers boards use; some real moves are in that bin, and none of the moves printed here are guaranteed to be anything but a relisting either. Sixteen days of recorded prices tell you what was asked, not what cleared.
Universe: catalog cards with a recorded price on both the first three days (2026-08-29 to 08-31) and the last three days (2026-09-12 to 09-14) of our daily canonical price store: 35,885 cards after excluding 531 whose change was 60% or more in magnitude; 20,915 English and 14,970 Japanese. English figures are reported; Japanese cards, 78% of which were flat, are excluded from the tables. Price is the cheapest-printing market price, median of the three days at each end. Up and down mean a change of more than 2%; flat is within 2%. Mean change is the arithmetic mean of per-card changes; value-weighted change is the sum of end prices over the sum of start prices minus one. Era follows the set prefix; the set tables require 30 or more priced cards per set. The index figure is the moonstone Pokémon Index closing level on 2026-08-29 and 2026-09-14 from the same series the homepage charts. The flagship-column robustness check uses 2026-09-07 to 09-08, the first two days under the new rule, against 09-13 to 09-14, with the same 60% exclusion, so both of its endpoints sit on one side of the change. Not financial advice.