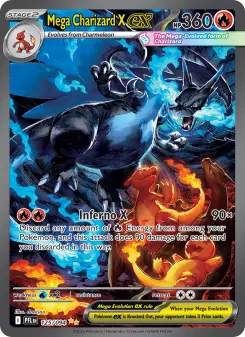


Price gets all the attention; volume tells you what the market is actually doing. We pulled every recorded eBay sale across 9,261 cards in our tracked universe and ranked the hobby by trading velocity. Two findings stand out. First, trading concentrates overwhelmingly in the newest chase cards and icon reprints — the top of the tape is Mega-era Charizards and modern Mews, not vintage. Second, and more usefully: when we join volume to our 18-month price histories, the MOST-traded quintile appreciated half as much as the middle of the liquidity curve. In this market, the crowd's favorite cards were the worst compounders.
Where the hobby actually trades
The most-traded list is a portrait of the current moment: Mega-era Charizard printings occupy three of the top six slots, surrounded by Celebrations reprints, modern Mewtwo and Mew chases, and exactly one pre-2020 card in the top sixteen. Note the sales pace column — it is the current annualized run-rate from weekly velocity, and it separates cards that are trading HARD right now (Meowth Phantasmal Flames at ~2,850 sales a year) from cards whose big totals are history (Celebrations Palkia has 2,320 recorded sales but effectively zero current velocity).
The most-traded cards on the tape
| Card | Recorded sales | Current pace (/yr) | Median (raw comps) |
|---|---|---|---|
| Mega Charizard X ex · MEP Promos | 3,632 | ~1,657 | $70 |
| Mega Charizard X ex · Phantasmal Flames | 3,188 | ~1,221 | $950 |
| Palkia · Celebrations | 2,320 | cooled | $275 |
| Oricorio ex · MEP Promos | 2,280 | ~2,733 | $30 |
| Meowth · Phantasmal Flames | 2,214 | ~2,854 | $42 |
| Mew ex · Paldean Fates | 2,087 | ~2,769 | $750 |
| Meowth · Wizards Black Star Promos | 1,938 | cooled | $60 |
| Mewtwo VSTAR · Crown Zenith GG | 1,834 | cooled | $345 |
| Team Rocket's Mewtwo ex · Destined Rivals | 1,627 | cooled | $702 |
| Rayquaza · Vivid Voltage | 1,510 | ~2,056 | $53 |
The volume leaders — live pricing on every tile
Liquidity has not paid
Join the volume tape to our 18-month daily price histories and sort the 424 overlapping cards into liquidity quintiles. The result inverts the intuition that popular means profitable: the most-traded quintile returned a median +51% while the middle of the curve did +113 to +114%. The correlation between volume and return is negative across the whole join. The mechanism is the same one behind the launch-window tax in our loss-ledger study: the highest-velocity cards are new-set chases whose supply keeps arriving for months, and icon reprints printed to meet exactly the demand they attract. Scarcity can't develop where the printer is still running.
18-month median return by trading-volume quintile
Sales volumes are recorded eBay sold listings per card aggregated across all grades from Moonstone market data as of July 26, 2026; 'recorded sales' is the cumulative comp count on the books, and 'current pace' annualizes the card's present weekly sales velocity (×52) — the two measure different things and are labeled separately. eBay comp coverage skews toward graded sales by construction, so raw-heavy cards are under-counted relative to their true turnover; volume ranks should be read within that bias. The volume-return join uses the 424 cards that also carry ≥200 days of daily price history (January 2025 – July 2026, $10 floor), with returns measured between 14-day medians at the window's ends. Correlation is Pearson on log(1+volume) vs return. Nothing here is financial advice.