A research platform is judged on what it publishes. We would rather be judged on what it refuses to publish, because that is the part nobody shows you. On September 19 our target model ran across 25,471 cards and issued a price target on 3,432 of them. The other 22,039 got nothing, and 22,015 of those refusals carry a machine-written reason stored next to the card. The 24 that do not are a hole in our own audit trail, and they get a section of their own at the end. This article is that reason column, counted. It is not a flattering document. It says that 86.5% of our own catalog is, by our own rules, un-ratable, that there is a six-year stretch of Pokémon history where we have issued three ratings out of 3,260 cards, and that the most expensive cards we track are the ones we are least able to say anything about.
Why 22,039 cards got nothing
Our target engine can only speak when four things are true at once: the card has a raw price worth modelling, it has enough verified PSA 10 sales to anchor a graded multiple, that multiple survives a sanity check against the raw price, and there is a reference cohort of similar cards whose multiple can be borrowed if the card's own comps are thin. Fail any one and the engine writes a sentence explaining which, then moves on. Counting those sentences gives the table below. Two gates do almost all the work: the price floor and the comp-depth bar together account for 21,258 cards, 83.5% of everything we scored.
The full refusal census, September 19, 2026
| Outcome | Cards | Share of catalog | What the gate is doing |
|---|---|---|---|
| Below the $1.50 signal floor | 11,458 | 45.0% | listing minimums and seller spreads swamp any real demand signal |
| Zero verified PSA 10 comps | 8,024 | 31.5% | no graded tape at all to anchor a target |
| Fewer than 10 PSA 10 comps | 1,776 | 7.0% | some tape, not enough of it: the bar is 10 |
| Cohort multiple too far from market | 651 | 2.6% | the borrowed multiple implies a value more than 2.5x from the ask |
| PSA 10 median fails the sanity band | 90 | 0.4% | the graded median sits outside 0.85x to 40x of raw, so the comp pool is suspect |
| No usable reference cohort | 16 | 0.1% | no group of 20+ comparable cards prices cards like this one |
| No reason recorded | 24 | 0.1% | our bug, documented below |
| Issued a price target | 3,432 | 13.5% | HOLD 2,699 · BUY 416 · SELL 317 |
The comp-depth gate deserves a closer look, because it is where most of the recoverable refusals sit. 8,024 cards have no verified PSA 10 sale on our tape at all. Another 1,776 have between five and nine, which is to say they are close: 467 cards sit at exactly five comps, 401 at six, 342 at seven, 303 at eight, and 263 at nine. Those 263 cards are one recorded sale away from a rating. That is not a modelling problem, it is a data-collection problem, and it is the single highest-leverage thing we could fix. How many sales is a price explains why we set the bar at ten and not at three.
Cards stalled just under the comp bar
We have almost nothing to say about 2007 to 2013
Break the census by era and one result is not a gradient, it is a wall. Diamond & Pearl through HeartGold & SoulSilver through Black & White: 3,260 cards scored, three price targets issued. Not three percent. Three cards. For comparison we rate a quarter of the Japanese cards we score and a fifth of the Scarlet & Violet ones.
Rating coverage by era, September 19, 2026
| Era | Cards scored | Rated | Coverage |
|---|---|---|---|
| Japanese | 4,975 | 1,257 | 25.3% |
| Mega Evolution | 853 | 202 | 23.7% |
| Scarlet & Violet | 3,496 | 740 | 21.2% |
| Sword & Shield | 3,565 | 625 | 17.5% |
| Sun & Moon | 2,813 | 291 | 10.3% |
| XY | 1,683 | 98 | 5.8% |
| WotC | 1,790 | 92 | 5.1% |
| Other / unclassified | 1,156 | 52 | 4.5% |
| EX era | 1,880 | 72 | 3.8% |
| Black & White | 1,301 | 2 | 0.2% |
| HeartGold & SoulSilver | 545 | 1 | 0.2% |
| Diamond & Pearl | 1,414 | 0 | 0.0% |
The reason is not mysterious once you read the refusal strings for those eras. Diamond & Pearl splits almost exactly in half between the two big gates: 712 cards below the $1.50 floor and 690 with zero verified PSA 10 comps. Black & White is 756 below the floor and 521 with no comps. These are eras whose commons and uncommons are genuinely near-worthless, and whose few valuable cards are graded rarely enough that our sales tape never accumulates ten of anything. WotC is a different shape: only 388 of 1,790 cards fall below the floor, but 1,152 have no graded comps at all, which is what a 25-year-old catalog with a thin, high-value survivor pool looks like on a sales tape. We measured that survivor effect directly in the thin-registry study.
The most expensive cards we track are the ones we cannot rate
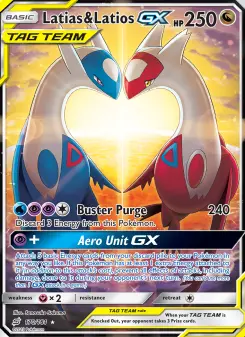
Sort the catalog by price band and the refusals are not concentrated at the bottom, they bracket both ends. Everything below the $1.50 floor is refused by construction, which is expected. What is less expected is the top: the 49 cards in our three highest price bands received zero targets between them. Latias & Latios GX is the clearest case. At $4,271.62 raw with 23 verified PSA 10 comps, it clears the comp bar comfortably, and it was still refused, for the rarest reason in the census: no reference cohort of at least 20 comparable cards carries a PSA 10 multiple that could be lent to it. There is nothing else priced like it to borrow from. The engine's honest answer at the very top of the market is that the sample size of the market itself is one.
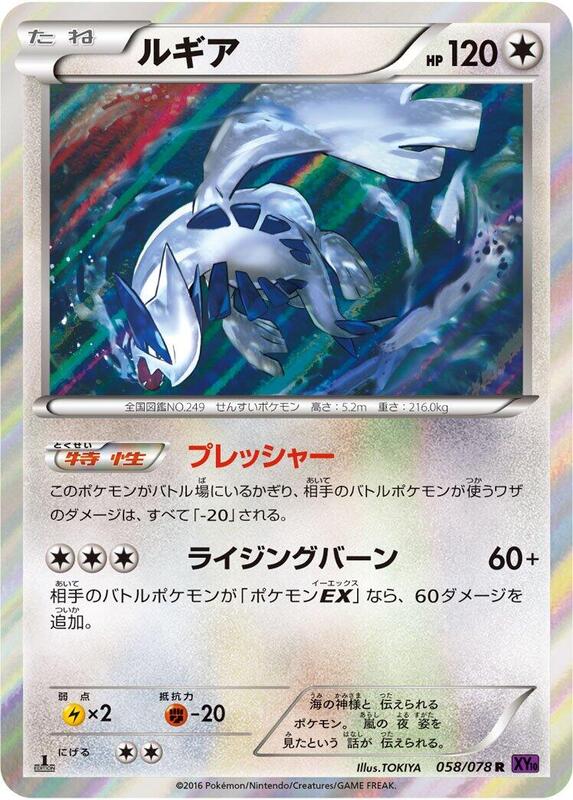
Below it the reason changes back to comps. Mew ☆ δ at $3,500, Rayquaza ☆ at $2,500.99, Lugia ex at $2,500 and Rocket's Mewtwo at $2,400 all have zero verified PSA 10 sales on our tape. Four-figure cards trade a few times a year, which is exactly the point the liquidity ledger made from the other direction: the market's trophies trade four times a year, and four is not ten.
Ninety cards where the graded median is not believable
The sanity band is the smallest gate in the census and the most interesting. It refuses a card when its PSA 10 median sits outside 0.85x to 40x its raw price, on the theory that a comp pool producing a 60x multiple is probably matching the wrong card. It caught 90 cards. Of those, 83 failed on the high side and every one of them landed between 40.06x and 44.52x: a tight cluster just past the line. Seven failed low, between 0.56x and 0.82x, which is the stranger case, a graded copy selling for less than the raw ask.
Sanity-band failures, the high side
| Card | Set | Raw | PSA 10 median | Comps | Multiple |
|---|---|---|---|---|---|
| Vaporeon | Jungle | $15.89 | $707.50 | 25 | 44.5x |
| Misdreavus | Wizards Black Star Promos | $9.89 | $440.00 | 19 | 44.5x |
| Charizard G | Supreme Victors | $450.72 | $20,003.00 | 14 | 44.4x |
| Mewtwo EX | BREAKthrough | $12.45 | $552.50 | 13 | 44.4x |
| Magearna | XY Black Star Promos | $29.21 | $1,296.23 | 24 | 44.4x |
| Claydol | Chaos Rising | $1.60 | $71.00 | 15 | 44.4x |
We are not claiming these multiples are wrong. A Supreme Victors Charizard G at 44x is entirely plausible for a card whose raw copies are beat up and whose gem copies are trophies. The gate exists because we cannot tell that apart from a matching error without looking, and a target built on a mismatched comp pool is worse than no target. Ninety cards is the price we pay for that rule. It is cheap.
3,432 opinions, and most of them are 'do nothing'
The 3,432 cards that cleared every gate did not all get an exciting answer. 2,699 of them, 78.6%, came back HOLD, meaning the model's fair value sits close enough to the market price that there is no trade. 416 came back BUY and 317 came back SELL. A model that produces a strong opinion on 733 cards out of 25,471 is either very disciplined or very blind, and the honest position is that it is some of both.
The strongest BUY calls, ranked by modelled upside
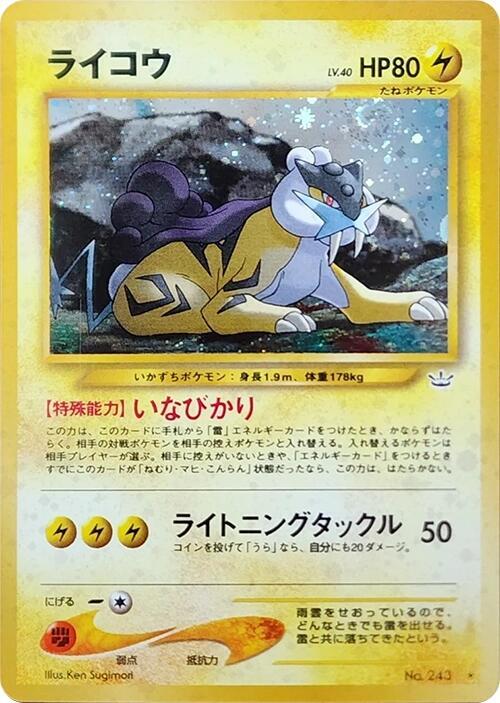
The strongest SELL calls, ranked by modelled downside


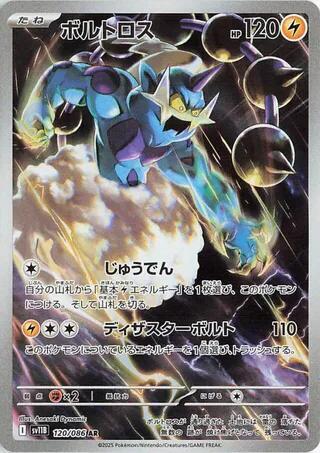
Both of those lists are extremes, and extremes are exactly where evidence runs thinnest: the eight cards above rest on between 11 and 30 verified sales apiece, tens rather than hundreds. Across the full board the picture is genuinely mixed rather than the clean story we expected to find. The median BUY rests on 28 verified sales and the median SELL on 39, which says the sell side is better evidenced at the middle. But the mean runs the other way, 111.9 for BUY against 80.8 for SELL, because a handful of heavily-graded modern cards sit on the buy side: the deepest-evidenced call we issue is a BUY on Mega Charizard X ex with 2,986 recorded PSA 10 sales behind it. We had written a tidier paragraph here claiming our buy side is structurally the weaker one. The full distribution does not support it, so it is gone.
The 24 rows with no reason at all
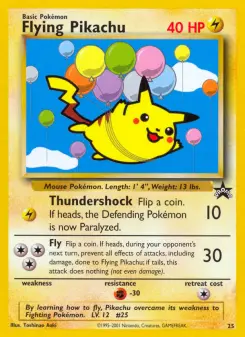
The census should add to 25,471 with every row explained, and it nearly does. Twenty-four cards came back with neither a target nor a refusal string. They have one thing in common: no raw price at all, which means they fall out of the pipeline before the stage that writes the reason. Pikachu 227/S-P, the original Wizards Black Star Promos Pikachu and Mario Pikachu are among them. The rating is correctly withheld in all 24 cases. What is wrong is that our own audit column cannot tell you why, and an audit column with silent rows is not an audit column. It is fixed as of this piece: those rows now record 'no raw price is on the tape for this card, so there is nothing to build a target from', and the next nightly build will fill them in. We are publishing the count rather than quietly folding it into the bucket it belongs in, because 24 is exactly the size of error that survives forever if nobody names it.
Source: our report_features table as of the September 19, 2026 build (25,471 rows, one per scored card). 'Rated' means a non-null target call; 'refused' means a recorded refusal string. Refusal strings are grouped by their generated prefix into the seven buckets shown, and the buckets plus the rated count sum exactly to 25,471. Raw prices are TCGplayer market values from our daily series; PSA 10 medians and comp counts are from our recorded graded sales tape, not provider estimates. Era buckets are our own classification of set names. Price bands are logarithmic bands of raw price; the '49 cards in the top three bands' figure covers bands 10 through 12. Target prices and upside percentages are model output as of that build and will move as comps accumulate; they are analysis, not measurements of the future, and nothing here is financial advice.