
Every graded price on this site, and on every site, is a median. A median is a single number standing in for a distribution, and the honest question is how wide that distribution is before the summarising starts. Our graded ladder cache stores the low, the median and the high of the verified sold window for every card and grade it holds, which lets us answer it. Among English cards whose PSA 10 window holds 20 to 40 verified sales, the high is a median 4.00 times the low. Not across cards. Within one card, one grade, one plastic slab, one comp window.
Comparing ranges honestly means comparing at equal depth
A high-to-low ratio is an extreme, and extremes grow with sample size for purely mechanical reasons: watch a card for 500 sales and you will see a wilder best and worst than you would in 25, even if the underlying market never changes. Anybody quoting one card's range against another card's range without checking the sale counts is measuring popularity, not volatility. So the table below never mixes depths. Read down the rows to see how the range widens with depth, and compare cards only within a row. It is worth knowing what the table leaves out: of the 261 English PSA 10 windows we can resolve to a named card, 146 hold fewer than 20 verified sales and appear nowhere below, so this is a study of the deep end of our own tape rather than of the board.
PSA 10 high-to-low ratio by tape depth, English cards
| Verified sales in window | Cards | Median high/low | 25th percentile | 75th percentile |
|---|---|---|---|---|
| 20 to 40 | 33 | 4.00x | 2.95x | 6.04x |
| 40 to 80 | 17 | 3.56x | 3.02x | 5.00x |
| 80 to 160 | 20 | 4.00x | 3.37x | 5.53x |
| 160 to 400 | 31 | 5.99x | 4.27x | 6.99x |
| 400 or more | 14 | 4.69x | 4.11x | 6.16x |
Going from a median of 29 sales to a median of 505 sales, a seventeen-fold increase in observation, moves the typical range from 4.00x to 4.69x and the upper quartile from 6.04x to 6.16x. The deepest band is statistically indistinguishable from the shallowest one, which is the finding: if the underlying price were a tight distribution with occasional outliers, seventeen times as many draws should have pulled the extremes much further apart. They did not, which points at genuine width rather than a few bad prints in the tail. The one band that does stand out is 160 to 400 sales, at a 5.99x median, and we have no mechanism to offer for it beyond noting that it is where the modern high-attention cards cluster. An earlier version of this table reported the deepest band's upper quartile as 4.92x, on a percentile convention that is not the standard one; on the standard linear-interpolation convention it is 6.16x, and on nearest-rank 6.58x. The corrected figure makes the deepest band wider, not narrower, and the conclusion above is written to the corrected figure.
The grades overlap, and not by a little
Take the 98 ENGLISH cards holding at least 20 verified sales in both PSA 10 and PSA 9. On 55 of them, 56.1%, at least one PSA 9 sold for more than the cheapest PSA 10. The two grades are not two price levels. They are two overlapping clouds with different centres, and on more than half the board the clouds touch. The cohort is English-only on purpose; adding the 12 Japanese cards that also qualify gives 110 cards and 62 inversions, 56.4%, which is the same answer on a mixed population, and an earlier draft quoted that mixed count as though it were the English one.
Where the ladder inverts: six of the 55, chosen for depth (verified sold windows, tape through late August 2026)
| Card | PSA 10 median (low, sales) | PSA 9 median (high, sales) |
|---|---|---|
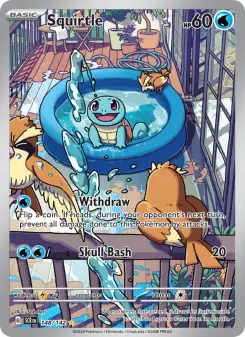
| Squirtle, Stellar Crown | $407.14 (low $120.50, 542) | $127.50 (high $505.76, 571) |
| Charizard ex, Obsidian Flames | $86.00 (low $22.99, 161) | $24.99 (high $89.99, 123) |
| Psyduck, Ascended Heroes | $480.00 (low $129.99, 830) | $121.50 (high $404.00, 353) |
| Mega Charizard X ex, MEP promo | $228.50 (low $59.99, 1,028) | $57.00 (high $157.00, 637) |
| Jessie & James, Hidden Fates | $190.00 (low $103.85, 521) | $70.00 (high $250.00, 286) |
| Charizard V, SWSH promo | $89.99 (low $38.00, 381) | $28.99 (high $90.72, 177) |
Squirtle is the cleanest illustration on the board because nobody can call it thin: 542 verified PSA 10 sales and 571 PSA 9 sales, and the best PSA 9 outsold the worst PSA 10 by a factor of four. A buyer who paid $505.76 for the 9 and a buyer who paid $120.50 for the 10 transacted in the same market, in the same window, on the same card. One of them read the grade. The other read the price.
The widest and the tightest, at comparable depth
The widest six and the tightest three PSA 10 windows on English cards with 100 or more verified sales
| Card | Low | Median | High | Sales | High/low |
|---|---|---|---|---|---|
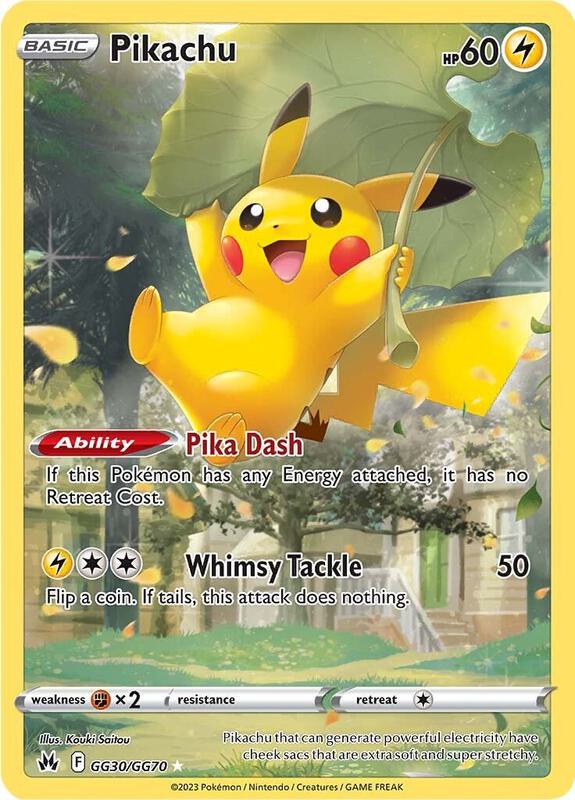
| Pikachu, Crown Zenith Galarian Gallery | $112.00 | $378.17 | $1,401.26 | 215 | 12.51x |
| Charizard ex, Obsidian Flames | $22.99 | $86.00 | $269.95 | 161 | 11.74x |
| Clefairy, Perfect Order | $53.00 | $195.01 | $520.00 | 362 | 9.81x |
| Rayquaza VMAX, Evolving Skies | $1,094.00 | $2,700.00 | $10,000.00 | 371 | 9.14x |
| Umbreon V, Brilliant Stars Trainer Gallery | $70.00 | $259.79 | $600.00 | 237 | 8.57x |
| Mega Gardevoir ex, Mega Evolution | $260.00 | $660.00 | $2,080.00 | 169 | 8.00x |
| Victini, White Flare | $750.00 | $1,275.00 | $2,000.00 | 272 | 2.67x |
| Eevee, Twilight Masquerade | $170.50 | $305.00 | $450.00 | 477 | 2.64x |
| Machamp V, Astral Radiance | $254.61 | $420.00 | $599.99 | 201 | 2.36x |
The bottom three rows are the important ones, because they prove the top rows are not inevitable. Machamp V, Eevee and Victini all carry 200 to 477 verified sales and all trade inside a band of roughly two and a half times. Depth does not force width. What appears to force width is a card whose population is being minted quickly while attention is high, which describes Clefairy and the Ascended Heroes cohort exactly, and cards where several visually similar printings share a name, which is the contamination mechanism we documented in The $479 Lie and mapped across the catalog in The 10,872 Cards That Look Like Other Cards.
One thing this is not is a filtering failure. Across the company-and-grade records in this cache, the verifier accepted 176,268 sold listings and discarded 23,315, 11.7% of the candidate pool, with at least one rejection on 25.1% of records. The ranges above are what SURVIVED that filter. Every quoted low and high is a listing that passed a title check for the exact card, the exact printing and the exact grade.
This piece is about the width behind a SOLD median. The width behind a quoted price is a different problem with a different answer, measured in The Frozen Tape.
Source: the moonstone graded ladder cache, 2,870 payloads covering 1,550 distinct cards, each storing per company and grade the verified sold median, sale count, minimum and maximum of the same window; where a card carries more than one payload the most recently written is used. Payloads were written between August 19 and September 2, 2026, with 88% stamped on August 20 and 21, so the windows age by up to two weeks across cards; low, median, high and count always come from one window on one card, never spliced. This study uses the 261 PSA 10 records that resolve to a named English card in our catalog, of which 115 carry 20 or more verified sales and enter the depth table, and the 98 English cards holding 20 or more verified sales in both PSA 10 and PSA 9. High-to-low ratios are order statistics and grow with sale count for mechanical reasons, which is why every comparison is made inside a depth band and why the full band table is published rather than a single headline ratio. Quartiles use linear interpolation between order statistics, the standard convention; an earlier version of the depth table used a different convention that understated the deepest band's upper quartile as 4.92x against a corrected 6.16x. Residual width has several causes we cannot separate with the fields we store: auction versus fixed-price venue, shipping-inclusive prices, sale timing inside the window, qualifier labels such as OC on an otherwise gem slab, and same-name printings that pass a title check. We can bound one of them: 11.7% of candidate sold listings were rejected by the verifier before any figure here was computed. Rejection counts are recorded per record by the graded feed and are reported as recorded. Nothing here restates a median as wrong; it reports how wide the distribution behind each median is. Not financial advice.