
Everyone submits for the ten. Fewer people ask which grade the market is actually transacting in. Our tape records, for every published graded median, the number of individually verified sold comps behind it, so the question has an answer. Across the 5,998 products holding both a PSA 10 and a PSA 9 sold median on September 22, 2026, 2,004 of them, 33.41%, have more recorded PSA 9 sales than PSA 10 sales. That share is not spread evenly. On cards whose PSA 10 sells between $25 and $50 it is 11.18%. On cards whose PSA 10 clears $1,000 it is 74.62%.
The share climbs at $100 and again at $250
Share of cards with a deeper PSA 9 comp pool than PSA 10 comp pool
Which grade carries the recorded sales, by PSA 10 sold median (5,998 products, none excluded)
| PSA 10 sold median | Cards | PSA 9 pool deeper | Share | Median PSA 10 comps | Median PSA 9 comps |
|---|---|---|---|---|---|
| Under $25 | 82 | 12 | 14.63% | 12 | 5 |
| $25 to $50 | 850 | 95 | 11.18% | 22 | 7 |
| $50 to $100 | 1,209 | 147 | 12.16% | 32 | 12 |
| $100 to $250 | 1,411 | 355 | 25.16% | 27 | 15 |
| $250 to $1,000 | 1,524 | 707 | 46.39% | 13 | 13 |
| $1,000 and up | 922 | 688 | 74.62% | 10 | 20 |
Read the last two columns together and the mechanism is visible. The PSA 10 comp pool does not just lose its lead as price rises, it SHRINKS in absolute terms, from a median of 32 sales in the $50 to $100 band to 10 above $1,000, while the PSA 9 pool ends higher than it started, 12 against 20, dipping to 13 in the $250 to $1,000 band on the way. The expensive ten is both rarer and more closely held. The nine is the grade that changes hands.
In aggregate the tens still win, and it matters to say so: across all 5,998 products the PSA 10 medians rest on 374,009 verified comps and the PSA 9 medians on 236,230. Nearly all of that 137,779-comp lead comes from cards worth under $250, where the tens hold 259,510 against 125,157. At $250 and above the two pools are almost level, 114,499 against 111,073, a lead of 3,426. Cheap cards are most of the catalog and almost none of the money.
What a three-sale median is
The tape refuses to publish a graded median on fewer than three verified comps, so three is the floor rather than a coincidence. Here are the ten cards, among the 471 whose PSA 10 clears $1,000 and whose PSA 9 carries 20 or more verified comps, with the widest gap between the two pools. Every one of them has a four or five figure PSA 10 price standing on a handful of sales and a PSA 9 price standing on dozens.
Deepest nine tape against thinnest ten tape: ranks 1 to 10 of 471, ordered by the comp ratio descending
| Rank | Card | Set | PSA 10 (comps) | PSA 9 (comps) | Comp ratio |
|---|---|---|---|---|---|
| 1 | Wigglytuff | Jungle | $3,793.50 (3) | $215.00 (93) | 31.0 to 1 |
| 2 | Rainbow Energy | Team Rocket | $1,887.49 (3) | $123.00 (64) | 21.3 to 1 |
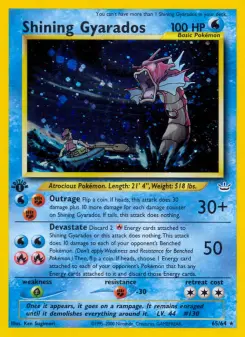
| 3 | Shining Gyarados | Neo Revelation | $26,839.45 (4) | $5,850.00 (74) | 18.5 to 1 |
| 4 | Koga's Beedrill | Gym Challenge | $3,425.00 (3) | $139.25 (40) | 13.3 to 1 |
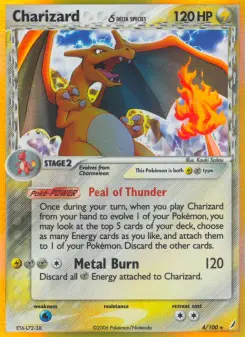
| 5 | Charizard δ | Crystal Guardians | $21,347.50 (5) | $2,112.50 (60) | 12.0 to 1 |
| 6 | Scizor | Neo Discovery | $1,699.99 (3) | $255.00 (36) | 12.0 to 1 |
| 7 | Blastoise EX | XY Black Star Promos | $13,874.99 (4) | $1,071.25 (47) | 11.8 to 1 |
| 8 | Milotic δ | Dragon Frontiers | $2,375.00 (3) | $278.73 (35) | 11.7 to 1 |
| 9 | Espeon | Neo Discovery | $11,000.00 (5) | $1,971.62 (58) | 11.6 to 1 |
| 10 | Dark Arbok | Team Rocket | $1,903.50 (4) | $152.88 (46) | 11.5 to 1 |
Wigglytuff from Jungle is the archetype. Its PSA 10 median of $3,793.50 is drawn from three verified sales in the card's entire recorded history. Its PSA 9 median of $215.00 is drawn from 93. If you want to know what a Jungle Wigglytuff is worth, the honest answer is that we know what the nine is worth and we have an estimate of the ten.
Three ways this could be wrong
First objection: comp counts measure our provider's coverage, not the market. Partly true, and it is why the whole finding is phrased as RECORDED sales rather than as sales. But coverage is applied to both grades of the same card by the same pipeline on the same day, so a coverage gap would have to be grade-dependent AND price-dependent to manufacture this pattern, and it would have to change direction exactly where the price crosses $250, which is where the deeper-nine share jumps from 25.16% to 46.39%.
Second objection: the comp pool is a lifetime count, so it rewards grades that have existed longer. Both grades of one card have existed for the same length of time, which is the point of comparing them within a card rather than across cards. What the lifetime nature does mean is that a ratio here is a statement about the whole recorded history of that card's tape, not about the last month.
Third objection: the population is cards that happen to hold both grades, and that is a selection. It is, and the size of it is printed: 2,679 products hold a PSA 10 median with no PSA 9 one, and 2,295 hold a PSA 9 median with no PSA 10 one. Those absences are NOT RECORDED rather than zero, and including them as zeros would be the single fastest way to fabricate this finding, so they are excluded entirely. Related work: how many sales is a price, the $7,500 card that never trades, and is a PSA 9 half a PSA 10, which prices the same two grades against each other.
What would overturn this
A recompute over `graded_snapshots` on the same evaluation day that found the deeper-nine share below half in the top price band, or that found it flat across the six bands rather than rising, would overturn the finding. The mechanism claim is separately testable: from the $50 to $100 band upward the median PSA 10 comp count must FALL as price rises, from 32 to 10, while the PSA 9 count ends higher than it started, 12 against 20, with one dip to 13 in the $250 to $1,000 band. Below $50 the ten is the deeper pool and still rising, which is the point. A recompute showing both counts rising together across the top four bands would break the explanation without breaking the headline.
Source: `graded_snapshots` (product key, grade, UTC day, median, sample_size), latest row per product and grade with a median above zero on or before day 20718 (September 22, 2026 UTC). Day 20719 is excluded because it was the UTC day still being written while this study ran, 7,207 rows against 29,676 on day 20718 at the time of the query and still filling afterwards. The population is every product holding BOTH a PSA 10 and a PSA 9 row under that rule, 5,998 of them, with NO comp gate applied, so the six price bands partition the whole population exactly once and their counts sum to 5,998. `sample_size` is the provider's count of kept verified sold comps behind that published median; it is a lifetime pool rather than a window, it is not capped, and the tape refuses to publish a median standing on fewer than three. Comparisons are always between the two grades OF THE SAME PRODUCT, so provider coverage, card age and collecting history are held constant by construction. Ties are counted as neither grade deeper and printed: 3,740 products have a deeper ten pool, 2,004 a deeper nine pool and 254 are tied, summing to 5,998. Price bands are cut on the PSA 10 sold median. All figures here are SOLD medians and comp counts from verified graded sales; no ask appears in this study. The graded tape is keyed on either the TCGplayer product id or the catalog id and both are asked; 1,443 rows carry a key we cannot map to a product and are excluded, and an unmappable row cannot enter a within-product comparison. EVERY COUNT IS DEDUPED ON THE TCGPLAYER PRODUCT ID: 1,212 ids are claimed by two catalog rows each, and where two rows reach one product the deeper comp pool is kept. The named table is the head of a single ranking of the 471 products whose PSA 10 clears $1,000 and whose PSA 9 carries 20 or more verified comps, ordered by PSA 9 comps divided by PSA 10 comps descending with ties broken on the product id, printed with no rank skipped. That 20-comp gate is a selection and it is the reason the table is not simply the thinnest ten pools in the catalog. Medians use the upper-middle nearest-rank convention, the value at index floor(p x n) of the ascending sample. An absent grade is NOT RECORDED, never zero: 2,679 products hold a PSA 10 median and no PSA 9 one, 2,295 the reverse, and all of them are excluded. Not financial advice.