
The rule of thumb every grading thread repeats is that a PSA 9 is worth about half a PSA 10. We can check it against every card our tape prices in both grades. On September 22, 2026 that is 5,998 distinct products, and the median one has a PSA 9 sold median worth 24.54% of its PSA 10 sold median. Not half. Slightly under a quarter. Only 439 of the 5,998, which is 7.32%, sit anywhere between 45% and 55%, and 5,131 of them sit below 45%. The half rule is not a bad approximation. It is the answer to a different question.
Where the half rule is true
The half rule has a home. It is the 90th percentile of this distribution: exactly 50.00% is where the ninth decile cut falls. Which means the people quoting it are quoting the top tenth of the nine-to-ten relationship as though it were the middle. The middle is 24.54%, the quarter cut below it is 15.36%, and one card in twenty sits at or below 7.68%.
The PSA 9 as a share of the PSA 10, whole population (5,998 products, September 22, 2026)
| Percentile | PSA 9 sold median over PSA 10 sold median |
|---|---|
| 1st | 4.73% |
| 5th | 7.68% |
| 10th | 10.03% |
| 25th | 15.36% |
| 50th | 24.54% |
| 75th | 36.76% |
| 90th | 50.00% |
| 95th | 60.44% |
| 99th | 83.90% |
The ratio is a price ladder
Sort the same 5,998 cards by what the PSA 10 sells for and the ratio falls at every step, from 64.62% on the cheapest tier to 13.90% on the dearest. That is the real shape, and it explains why the half rule feels right to some people and absurd to others: it is roughly right on a $30 card and wrong by a factor of four on a $2,000 one. The six tiers below partition all 5,998 cards with none left over.
Median PSA 9 as a share of the PSA 10, by PSA 10 sold median
The same ladder with the cash behind it, cards carrying 10 or more verified comps in both grades (2,946 of 5,998)
| PSA 10 sold median | Cards | Median 9 over 10 | Quarter cut | Three-quarter cut | Median PSA 10 | Median PSA 9 |
|---|---|---|---|---|---|---|
| Under $25 | 11 | 66.17% | 45.63% | 79.55% | $22.75 | $11.25 |
| $25 to $50 | 312 | 40.50% | 32.79% | 50.00% | $40.50 | $15.99 |
| $50 to $100 | 657 | 31.26% | 24.00% | 38.76% | $72.04 | $21.25 |
| $100 to $250 | 792 | 23.04% | 16.36% | 32.11% | $152.50 | $34.00 |
| $250 to $1,000 | 736 | 17.95% | 11.49% | 28.10% | $425.00 | $80.00 |
| $1,000 and up | 438 | 13.88% | 9.65% | 20.82% | $2,425.00 | $395.96 |
The cash column is the part that matters to anyone holding a submission form. On a card whose PSA 10 sells for $2,425, a 10 is not the likely outcome: of the 384 cards in this cohort whose PSA 10 clears $1,000 and that also sit on a surviving PSA registry of 50 or more slabs, 360 gem less than half the time, at a median gem rate of 14.65%. The 9 that a submission usually returns instead carries a $395.96 median. The gap between those two numbers is the whole grading bet, and it is far wider than the half rule implies.
Three ways this could be wrong
First objection: the medians are built on thin comp pools, and thin pools drift. So here is the same figure at five comp gates. It does not move. The population shrinks from 5,998 to 1,336 and the median ratio travels from 24.54% to 25.43%, a range of less than a point, while the share landing in the half band stays between 6.69% and 7.32% throughout.
Every figure at five comp gates, applied to BOTH grades
| Minimum verified comps on each grade | Cards | Median 9 over 10 | Share between 45% and 55% |
|---|---|---|---|
| None (the tape's own floor is 3) | 5,998 | 24.54% | 7.32% |
| 5 or more | 4,545 | 24.39% | 7.19% |
| 10 or more | 2,946 | 24.06% | 6.69% |
| 20 or more | 1,826 | 24.96% | 7.12% |
| 30 or more | 1,336 | 25.43% | 6.96% |
Second objection: this is the era effect in disguise. The PSA 9 discount curve measured 78 cards and found vintage nines near 17 to 18 cents on the PSA 10 dollar against 38 for Sword and Shield era nines, which is a story about age rather than price. On 1,624 English cards whose set we can date, gated at 10 comps a side, the era pattern reproduces. Then hold the price constant and most of it disappears.
Era against price, English cards with a dated set and 10 or more comps in both grades (1,624 of 2,946)
| Set released | Cards | Median 9 over 10 | Median PSA 10 | Same era, PSA 10 above $1,000 | Cards in that cell |
|---|---|---|---|---|---|
| 1999 to 2002 | 125 | 15.92% | $551.85 | 11.67% | 45 |
| 2003 to 2010 | 59 | 14.89% | $3,049.99 | 14.89% | 50 |
| 2011 to 2019 | 234 | 16.90% | $648.12 | 12.05% | 82 |
| 2020 to 2026 | 1,206 | 25.96% | $101.99 | 38.17% | 26 |
Three of the four eras collapse into an 11.67% to 14.89% band once the comparison is restricted to cards whose PSA 10 clears $1,000, where the unrestricted era medians spanned 14.89% to 25.96%. Price does most of the work. It does not do all of it: the 26 modern cards above $1,000 read 38.17%, which is genuinely different from the older eras at the same price, so era is not nothing. The cheap end cannot arbitrate, because only 11 pre-2020 cards in this cohort have a PSA 10 under $100, and we draw nothing from 11 rows.
Third objection: Japanese products are dragging the number. They are doing the opposite. Of the 2,946 cards at the 10-comp gate, 2,362 are English and 584 Japanese, and the Japanese nines are the ones that hold their value: 33.80% against 22.49%. Strip the Japanese rows out and the English-only median falls further from half, not closer. That direction agrees with Japanese slabs, which found a flatter grade premium on Japanese cards on a fifth of this sample.
Both ends, named
These are the ten widest and the ten tightest pairs among the 1,826 cards carrying 20 or more verified comps in both grades, ranked by the ratio with no rank skipped in either direction. The comp count sits beside every figure because a $10,925 median on 27 sales and a $47.88 median on 123 sales are not equally settled.
The widest gaps: ranks 1 to 10 of 1,826, ordered by 9 over 10 ascending
| Rank | Card | Set | 9 over 10 | PSA 10 (comps) | PSA 9 (comps) |
|---|---|---|---|---|---|
| 1 | Emolga | Black Bolt | 3.00% | $350.00 (32) | $10.50 (28) |
| 2 | Palpitoad | Black Bolt | 3.68% | $339.50 (31) | $12.50 (44) |
| 3 | Raichu | Fossil | 3.84% | $950.00 (26) | $36.45 (50) |
| 4 | Reshiram & Charizard GX | SM Black Star Promos | 4.01% | $10,925.00 (27) | $438.06 (97) |
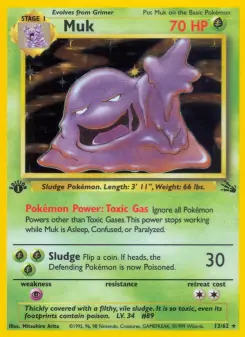
| 5 | Muk | Fossil | 4.03% | $1,674.99 (70) | $67.48 (223) |
| 6 | Snivy | Black Bolt | 4.10% | $634.88 (22) | $26.00 (53) |
| 7 | Haunter | MEP Black Star Promos | 4.36% | $1,149.50 (35) | $50.10 (138) |
| 8 | M Charizard EX | Flashfire | 4.40% | $1,999.50 (23) | $87.94 (32) |
| 9 | Togepi & Cleffa & Igglybuff GX | Cosmic Eclipse | 4.88% | $1,200.81 (50) | $58.65 (57) |
| 10 | Pikachu V | SWSH Black Star Promos | 4.95% | $758.89 (31) | $37.57 (25) |
The tightest pairs: ranks 1 to 10 of 1,826, ordered by 9 over 10 descending
| Rank | Card | Set | 9 over 10 | PSA 10 (comps) | PSA 9 (comps) |
|---|---|---|---|---|---|
| 1 | Charizard | Unnumbered Promotional cards (Japanese) | 98.05% | $192.50 (23) | $188.75 (21) |
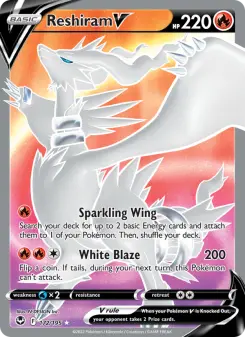
| 2 | Reshiram V | Silver Tempest | 95.31% | $59.00 (45) | $56.23 (23) |
| 3 | Celebi | Skyridge | 94.93% | $7,950.50 (33) | $7,547.50 (37) |
| 4 | Marnie's Pride | Brilliant Stars | 93.98% | $47.88 (123) | $45.00 (68) |
| 5 | ゲッコウガex | クリムゾンヘイズ (Japanese) | 90.06% | $262.00 (174) | $235.97 (20) |
| 6 | Boss's Orders (Giovanni) | Rebel Clash | 86.67% | $75.00 (98) | $65.00 (31) |
| 7 | Misty | City Gym Decks (Japanese) | 84.14% | $221.75 (90) | $186.59 (158) |
| 8 | Vileplume | Pokemon Jungle (Japanese) | 80.61% | $114.75 (36) | $92.50 (84) |
| 9 | Fletchinder | Paldea Evolved | 79.55% | $22.00 (26) | $17.50 (30) |
| 10 | Lillie's Clefairy ex | SVP Black Star Promos | 79.00% | $25.00 (51) | $19.75 (33) |
Celebi at rank three is the row worth sitting with. A $7,950.50 PSA 10 on 33 verified sales, a $7,547.50 PSA 9 on 37, and a five-figure card where the grade barely matters. Compare it with Muk from Fossil, where the 9 fetches 4.03% of the 10 on a far deeper 223-sale pool. Two cards, one grading scale, opposite economics.
What would overturn this
The claim is two sentences long and both are testable. A recompute over `graded_snapshots` on the same evaluation day, deduped on the product id, that returned a median PSA 9 share between 45% and 55%, or that found the six price tiers flat rather than falling monotonically, would overturn it. So would a comp gate at which the ladder inverts; we tested five and none does. Related work on the same tape: how much a PSA 10 adds, the basement of the registry, a CGC 10 sells for 42.50% of a PSA 10, and which grade actually trades.
Source: `graded_snapshots` (product key, grade, UTC day, median, sample_size), read as the latest row per product and grade with a median above zero on or before day 20718 (September 22, 2026 UTC). Day 20719 exists in the table and is excluded because it was the UTC day still being written while this study ran: it carried 7,207 rows against 29,676 on day 20718 at the time of the query, and because that day kept filling afterwards a later recompute will read a higher count on it. The population is every product holding BOTH a PSA 10 and a PSA 9 row under that rule, 5,998 of them, 4,053 English and 1,945 Japanese. Graded medians are SOLD medians from individually verified comps; `sample_size` is the provider's count of kept verified comps behind that median, and the tape does not publish a median below three of them. Raw asks appear nowhere in this study, so no figure here mixes an ask with a sale. The graded tape is keyed on either the TCGplayer product id or the catalog id, so both are asked and mapped to one product; 1,443 graded rows carry a key that is neither a product id nor a catalog id we hold and are excluded, and they cannot enter any figure here because a row with no product cannot be paired with anything. EVERY COUNT IS DEDUPED ON THE TCGPLAYER PRODUCT ID because 1,212 ids are claimed by two catalog rows each: 51,719 catalog rows with a product id collapse to 50,507 products, and where two rows reach the same product the deeper comp pool is kept. Medians and percentiles use the upper-middle nearest-rank convention: the value at index floor(p x n) of the ascending sample. Price tiers are cut on the PSA 10 sold median and partition the population exactly once; the headline ladder applies NO comp gate, and the gated version of the same ladder is printed beside it so the gate can be judged, along with the whole-population figure at five different gates. The era table uses release dates from our `setinfo:v4:` rows, which cover 110 of the 194 English set names in this catalog; 2,735 of the 4,053 English cards with both grades sit in a dated set, and 1,624 of those clear the 10-comp gate, so the era table describes that subset and says so in its title. The one registry figure in this study, the 14.65% median gem rate on 384 of the gated cards above $1,000, comes from `population_snapshots` under the same house rules as the rest of this wave: shared registry lines dropped, lines whose identity just changed withheld, no per-card absolute printed, and an absent gem count excluded rather than read as zero. The five inverted cards are listed rather than summarised: Mudkip (Nintendo Black Star Promos), Rocket's Mewtwo ex (Team Rocket Returns), Metagross Star (Delta Species), Team Aqua's Kyogre EX (Double Crisis) and Champions Festival (SWSH Black Star Promos). A product holding one grade and not the other is NOT RECORDED in the missing grade, never zero, and is excluded: 2,679 products hold a PSA 10 median with no PSA 9 one, and 2,295 the reverse. Ranking ties break on the product id ascending. Not financial advice.