Liquidity is the question you ask the day you want out. Price charts tell you what a card is worth on paper; the daily tape tells you whether anyone will actually hand you money for it this week. So we counted: for 500 of the market's busiest cards, every recorded eBay sale from July 12 through August 10, 2026. The answer is a market far narrower than its listing pages suggest. 6,041 recorded sales landed in those 30 days, and ten cards absorbed 42% of them, while 356 of the 500 candidates, including commons with more than 3,000 active listings each, did not record a single sale.
Cards sold per day, 30-day average
Liquidity lives at the top of the price ladder
Twenty-four of the twenty-five most-traded cards carry median sale prices above $500, and most sit between $1,000 and $4,300. The hobby's daily volume is not in affordable playables; it is in four-figure chase cards changing hands like blue chips. The grade mix says why: across the top 25 names, 39% of recorded sales were PSA 10 copies and another 25% were PSA 9s, against just 5% raw. The daily tape is largely a graded market, collectors and investors trading certified copies at tight, discoverable prices.
The deepest market in absolute terms belongs to Mega Charizard X ex from Phantasmal Flames: 518 recorded sales in 30 days, 17 a day, at a $1,900 median. A seller at fair market exits the same day. The Van Gogh Grey Felt Hat Pikachu, two years past its promo window, still trades 11 times a day. And Moonbreon, the Evolving Skies alt-art Umbreon VMAX, proves depth survives price: 139 recorded sales in a month at a $4,261 median makes it the most liquid card we measured above four thousand dollars. Note what that claim is not. Eight cards in the table below trade faster than Moonbreon and every one of them is also a four-figure card, so the depth premium belongs to the $4,000 band specifically, not to four figures generally.
The daily movers
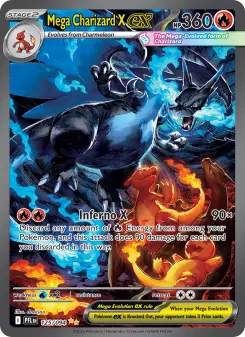


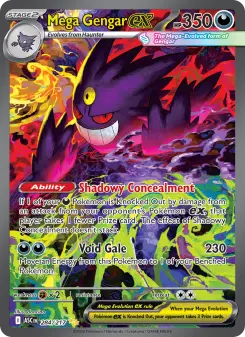




The top 15 by daily sales, with week-over-week pace
| Card | Sold / 30d | Per day | Last 7 days | Median price |
|---|---|---|---|---|
| Mega Charizard X ex 125/094 (Phantasmal Flames) | 518 | 17.3 | 14.0/day | $1,900 |
| Pikachu with Grey Felt Hat (SVP 085) | 344 | 11.5 | 11.0/day | $1,288 |
| Mew ex 232/091 (Paldean Fates) | 289 | 9.6 | 8.7/day | $1,125 |
| Pikachu ex 276/217 (Ascended Heroes) | 259 | 8.6 | 3.3/day | $2,325 |
| Mega Gengar ex 284/217 (Ascended Heroes) | 256 | 8.5 | 7.6/day | $2,152 |
| Lugia V alt art (Silver Tempest) | 212 | 7.1 | 6.1/day | $1,350 |
| Umbreon ex SIR (Prismatic Evolutions) | 206 | 6.9 | 7.1/day | $1,675 |
| Team Rocket's Mewtwo ex (Destined Rivals) | 204 | 6.8 | 6.3/day | $1,125 |
| Umbreon VMAX alt secret (Evolving Skies) | 139 | 4.6 | 4.1/day | $4,261 |
| Mewtwo GX secret (Shining Legends) | 132 | 4.4 | 4.7/day | $1,524 |
| Mega Dragonite ex 290/217 (Ascended Heroes) | 132 | 4.4 | $1,505 | |
| Gengar VMAX alt secret (Fusion Strike) | 127 | 4.2 | $1,843 | |
| Giratina V alt art (Lost Origin) | 126 | 4.2 | $1,000 | |
| Dragonite V alt art (Evolving Skies) | 120 | 4.0 | $1,050 | |
| Rayquaza VMAX alt secret (Evolving Skies) | 109 | 3.6 | $2,700 |
Listings are not liquidity
The sweep's most clarifying result is the 356 cards that recorded nothing. That club includes every bulk common we tested: Exeggcute, Paras, and Shellder each sit under more than 3,200 active listings, and none of them recorded a single sale in a month. A listing wall is supply waiting, not demand arriving. If your exit plan for a card is 'there are thousands of listings, so it must trade,' the tape disagrees. Among cards that traded at all, the median was just 20 sales in 30 days, one sale roughly every 36 hours.
Pace also shifts under your feet. Pikachu ex 276/217 from Ascended Heroes averaged 8.6 sales a day across the month but only 3.3 a day over the last week, the sharpest cooldown in the top ten, consistent with a fresh chase card settling after launch. Umbreon ex SIR ran the other way, slightly faster in week four than its monthly average. A liquidity rank is a snapshot, not a property of the card.
Universe: 500 candidate cards drawn from moonstone's market cache, the union of the 300 highest active-listing counts and the 200 highest market values, deduplicated. For each card we pulled its recorded eBay sales feed (dated, per grade) and counted sales landing July 12 through August 10, 2026 (the last 30 full days as of the August 11 pull). 'Recorded sales' is the comp tape used to price the market: it captures graded sales and price-relevant raw sales, and under-counts low-value bulk transactions, which is precisely why a 3,000-listing common can show zero. Medians are the middle recorded sale price in the window across all grades, so they sit near where the volume actually is (heavily PSA 9/10). Week-over-week pace compares the final 7 days with the 30-day average, and is reported only for the top ten, which is why the last five rows of the table leave that column blank rather than filling it. Every figure above comes from that single pull; nothing is modeled.