Ask what a card is worth and there are four defensible answers: the quoted market price, the cheapest copy actually listed, the median of recent raw sales, and the median of recent graded sales. They are not four estimates of one number. They price four different transactions. We measured how far apart they sit across 316 cards carrying all four with real samples behind the sold ones, and the answer is 5.77 times at the median. The graded sold median is the highest of the four on 301 of those 316 cards, and the quoted ask is the lowest on 246.
What each one is actually measuring
The quoted market price is an ASK: it is what our card pages print, and on 82.7% of priced lines it is identical to the cent to the cheapest copy for sale. The cheapest listing is the floor of the visible shelf. The raw sold median is the middle of up to 25 recent verified eBay sales of an ungraded copy, screened so no slab can pose as one. The graded sold median is the middle of verified sales of a specific slab in a specific grade, which is a different asset that happens to share a picture. Pricing a slab off a raw number, or a raw card off a slab number, is an expensive category error and a common one.
Most cards do not carry all four. Of 25,189 distinct products in our feature table with a quote and a listing floor, 18,245 carry only those two, 6,354 add a third, and 590 carry all four in any form. Requiring at least five verified raw comps and at least ten verified PSA 10 comps leaves 316. That attrition is itself the finding behind how many Pokémon cards have a real market: the full picture exists for about one product in eighty of the ones we already track closely.
How far apart the pairs sit
Pairwise disagreement between price sources
| Pair | Products | Typical ratio | 10th percentile | 90th percentile | Differ by more than 25% | Differ by 2x or more |
|---|---|---|---|---|---|---|
| Cheapest listing over quoted ask, ungated | 25,189 | 1.000 | 0.952 | 1.099 | 9.4% | 3.6% |
| Raw sold median over quoted ask, 5+ raw comps | 435 | 1.376 | 0.761 | 4.566 | 69.2% | 32.2% |
| Raw sold median over cheapest listing, 5+ raw comps | 435 | 1.344 | 0.645 | 4.544 | 72.0% | 34.9% |
| PSA 10 sold median over quoted ask, 10+ PSA 10 comps | 4,577 | 8.906 | 2.544 | 28.813 | 99.1% | 94.5% |
| PSA 10 sold median over raw sold median, both gates | 316 | 3.188 | 1.220 | 14.909 | 90.8% | 70.3% |
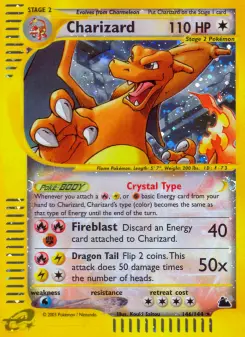
The first row is the one that surprises people. The quoted market price and the cheapest listing are the same number at the median and inside 10% at both tails, which is exactly what you would expect from a market where one listing usually sets the price. But 907 of those 25,189 products, 3.6%, differ by a factor of two or more, and on 720 of the 907 the floor is the HIGHER number. Charizard from Skyridge quotes at $249.95 while the cheapest listed copy asks $2,999.99. If you are buying, the quote is fiction and the floor is the price.
The last two rows are the expensive ones. A PSA 10 sold median sits 8.9 times above the quoted raw ask at the median across the 4,577 products whose PSA 10 median stands on at least ten verified sales, and 10.2 times across all 6,503 carrying both numbers at any depth, and that comparison is doing two things at once: it crosses from an ask to a sold median, and it crosses from a raw card to a slab. Our study of the ask against the raw sold price isolates the first crossing; the grading literature owns the second. Quoted alone, the 8.9x means nothing actionable, because the cost of turning the raw card into the slab is not in it.
Cheap cards disagree the most
Highest honest price over lowest, cards carrying all four
| Quoted ask | Products | Typical spread |
|---|---|---|
| Under $10 | 55 | 14.60x |
| $10 to $50 | 110 | 5.77x |
| $50 to $200 | 87 | 3.74x |
| $200 and up | 64 | 3.70x |
Across all 316 the median spread is 5.77x, the 25th percentile is 3.06x and the 90th is 26.63x. The gradient is steep and it runs the intuitive way for once: a cheap card's four prices disagree wildly because two of them are floors on a shelf and two of them are what somebody paid after shipping and grading, and those diverge in percentage terms when the card is cheap. Above $50 the spread settles at a little under four times, which is roughly the graded premium and very little else.
The five widest disagreements and the four narrowest, ranks unskipped
| Card | Quoted ask | Cheapest listing | Raw sold median | PSA 10 sold median | Spread |
|---|---|---|---|---|---|
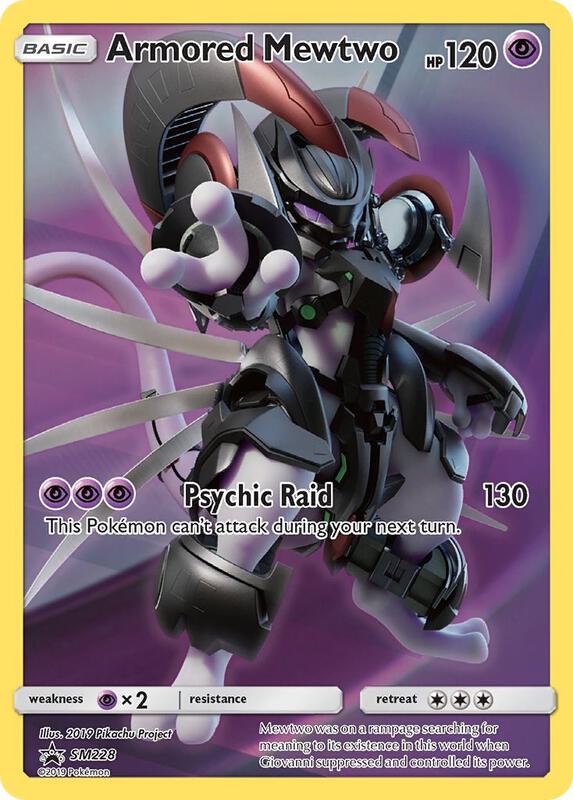
| Armored Mewtwo, SM Black Star Promos | $309.30 | $309.30 | $172.50 (14) | $12,300.00 (18) | 71.3x |
| M Charizard EX, Flashfire | $68.57 | $68.57 | $31.00 (25) | $1,999.50 (23) | 64.5x |
| Gengar EX, Phantom Forces | $768.15 | $768.15 | $550.00 (25) | $30,895.00 (11) | 56.2x |
| Gyarados δ, Holon Phantoms | $304.74 | $315.10 | $138.53 (25) | $7,750.00 (18) | 55.9x |
| Eevee, Hidden Fates | $4.45 | $2.78 | $10.25 (6) | $151.75 (46) | 54.6x |
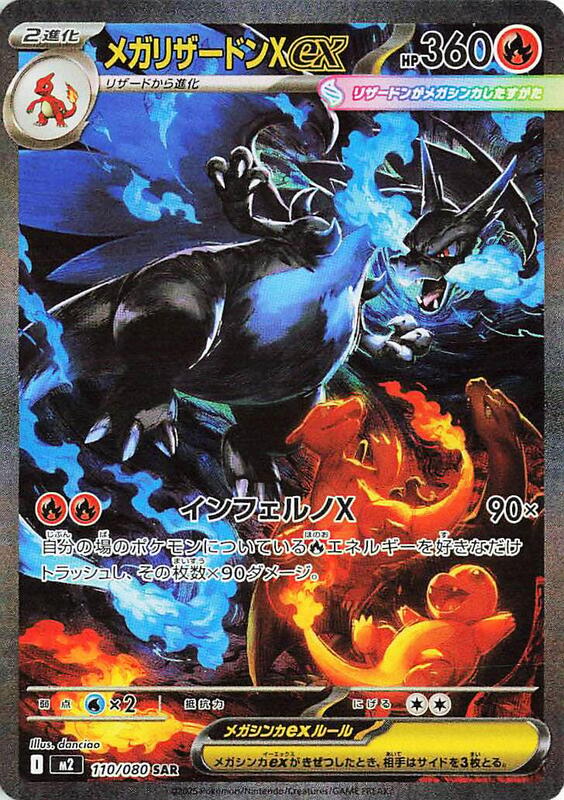
| Mega Charizard X ex, M2: Inferno X | $711.63 | $711.63 | $780.00 (25) | $811.50 (561) | 1.14x |
| Milotic ex, SV8: Super Electric Breaker | $99.72 | $99.72 | $120.00 (9) | $121.49 (110) | 1.22x |
| Mega Darkrai ex, M5: Abyss Eye | $242.80 | $242.80 | $317.00 (18) | $258.50 (421) | 1.31x |
| Charizard V, Champion's Path | $263.66 | $263.66 | $350.00 (25) | $382.50 (109) | 1.45x |
Parenthesised numbers are verified comp counts. The top five rows are ranks one to five of the 316 cards ordered by spread descending and the bottom four are ranks one to four of the same list ascending, both contiguous. The bottom four explain the top five. The cards whose four numbers agree are recent printings with deep graded pools, where the slab is barely a different product: Mega Charizard X ex carries 561 verified PSA 10 sales and its four prices sit inside 14% of each other, and the four narrowest rows carry 561, 110, 421 and 109 PSA 10 comps. The cards that disagree by fifty times carry 18, 23, 11, 18 and 46, and they are printings from 2006 to 2019 where the slab and the raw copy are different assets and the raw ask is the price of a lottery ticket rather than of the graded card.
Which number to use, and when
What would overturn this
The claim is that the four-number spread shrinks with price and with graded comp depth. It falls if a larger cohort shows the under-$10 band tightening to the same three-to-four times as the $200-plus band, or if cards with 500-plus graded comps are found with 50x spreads at any meaningful rate. The claim that the quoted ask is the lowest of the four in the large majority of cases is falsified by any cohort where it is lowest on under half the products. Both tests need more cards carrying all four numbers, which is exactly what our coverage is missing, not more days.
What this study cannot show
316 cards is a small and self-selected population: a card only reaches it by having a raw sold pool of five and a PSA 10 pool of ten, so it is biased toward cards people both trade and grade. The four numbers are not read at the same instant; the quote and the floor are from September 22, 2026, the raw sold median from September 21, and the graded medians from the same day's feature table. On a fast-moving card that mismatch is real and we have not corrected for it. The raw sold pool is capped at 25 comps. Condition is uncontrolled: the ask is a near-mint quote and the raw comps are whatever condition sold, which our condition tax study sizes at roughly a quarter off for lightly played. And a spread is not an opportunity: three of the four numbers describe transactions you cannot execute on the fourth one's terms.
Sources: `report_features` on day 20718 (September 22, 2026 UTC) for the raw ask and the PSA 10 sold median with its comp count; `price_history` on the same day for the quoted price and the cheapest listing; `ebay_divergence` on day 20717 for the raw sold median and its comp count. The report feature table's raw price equals the daily dump quote to the cent on 25,269 of 25,614 joined rows, 98.7%, so the two are treated as one instrument and the dump is used for the quote and the floor. EVERY COUNT IS DEDUPED ON THE MARKETPLACE PRODUCT ID, because 1,212 product ids are claimed by two catalog rows each: 25,614 joined rows collapse to 25,189 products, 425 of them duplicates, and the row kept is the one with the deepest PSA 10 pool, then the deepest raw pool. Without that step one product could appear twice in the named table. The strict cohort requires all four numbers plus at least five verified raw comps and at least ten verified PSA 10 comps, which leaves 316 products; the 590-product unrestricted count is printed beside it so the gate can be judged. Pairwise rows are NOT all unrestricted, and their denominators are printed because of it. The cheapest-listing row uses all 25,189 products. The two raw-sold rows require at least five verified raw comps, which takes 1,031 products carrying a raw sold median down to 435. The PSA 10 over ask row requires at least ten verified PSA 10 comps, which takes 6,503 down to 4,577. Those gates are selections on comp depth and every figure in those rows describes well-evidenced cards, not cards in general; ungated, the raw-sold-over-ask median is 1.574 on 1,031 products and the PSA 10 over ask median is 10.220 on 6,503. Spread is the maximum of the four numbers divided by the minimum. Medians and percentiles use the upper-middle nearest-rank convention: the value at index floor(p x n) of the ascending sample, which puts the median at the upper middle on even samples. The named table is the head and the tail of one ranking of the 316 by spread, printed with no rank skipped in either direction. Comp counts in the named table are the verified sold samples behind each median, printed so no reader takes a 561-comp figure and an 11-comp figure as equally settled. The raw sold pool is capped at 25 by construction, so a raw comp count never exceeds 25. Quoted prices and listing floors are ASKS. Raw and graded medians are SOLD medians. An absent number is not recorded, never zero. Not financial advice.