

There are two ways a price can be stale, and almost every price display shows you neither. The quote can be old, which is the familiar problem. Or the quote can be fresh while the evidence under it is old, which is worse, because a moving number reads as information. We measured both on the same cards over the same days. Across 25,938 card-and-grade pairs carrying a quoted price and a verified sold tape, 78.5% of the quotes that moved between September 18 and September 22, 2026 moved with no new recorded sale behind them at all.
Two thirds of sold medians took no new evidence in a week
Start with the number nobody publishes: how often a SOLD median learns something. Our graded tape records, for each card and grade every day, how many verified sales stand behind the median. Comp counts are close to monotone, so a count that has not risen is a week in which no new verified sale was recorded for that card in that grade. Across 25,022 series watched on all eight days from September 15 to September 22, 2026, that describes 16,855 of them, 67.4%. Not one series saw its count fall in that window.
Share of sold medians that recorded no new verified sale in seven days
| Comps behind the median | Series | No new sale in seven days | Median new comps |
|---|---|---|---|
| 3 to 4 | 6,351 | 94.7% | 0 |
| 5 to 9 | 7,226 | 78.1% | 0 |
| 10 to 19 | 4,728 | 64.5% | 0 |
| 20 to 49 | 3,732 | 45.9% | 1 |
| 50 to 99 | 1,417 | 23.9% | 1 |
| 100 or more | 1,568 | 5.8% | 4 |
Depth predicts freshness almost perfectly, which is unsurprising: a pool gets deep by taking sales. Price, on the other hand, predicts nothing. Sold medians under $25 went a week without a new sale 69.9% of the time and medians above $2,000 went a week without one 67.5% of the time, with the two middle bands at 65.1% and 68.3%. Staleness on the sold side is flat across four orders of magnitude of value. An expensive card is not a better-observed card.
The same measurement, by grade and by price
| Cut | Series | No new verified sale in seven days |
|---|---|---|
| PSA 10 | 7,333 | 60.3% |
| PSA 9 | 7,655 | 63.7% |
| CGC 10 | 4,939 | 67.9% |
| CGC 9 | 2,992 | 80.4% |
| CGC 9.5 | 1,007 | 86.9% |
| BGS 9 and BGS 9.5 | 1,096 | 84.0% |
| Sold median under $25 | 5,532 | 69.9% |
| Sold median $25 to $100 | 9,951 | 65.1% |
| Sold median $100 to $500 | 6,715 | 68.3% |
| Sold median $500 to $2,000 | 2,000 | 68.2% |
| Sold median $2,000 and up | 824 | 67.5% |
A third of quotes have not moved since our tape began
Our own daily price dump began accreting on August 30, 2026, so the longest window we can honestly measure is 23 days. Over it, 17,756 of 51,496 products carried an identical quote on the first and last day, 34.5%. At four days apart 72.9% of 52,086 products are identical and at one day apart 86.2% of 52,266 are. Those are census figures over the whole priced catalog on days where the sync ran to completion. The Frozen Tape measured the same phenomenon on a different instrument, a long provider price history read over its daily era and restricted to 6,684 cards with deep records, and found 37.5% of week-apart readings identical. Our tape carries two seven-day pairs that avoid the truncated sync days entirely, both of them early: August 30 to September 6, 2026 reads 50.6% identical across 51,733 products, and August 31 to September 7 reads 51.9% across 51,756. So at the one gap where the two instruments can be compared directly, ours is the stiller tape by thirteen to fourteen points. That is what you would expect when the denominator includes the bulk tail instead of only the cards worth tracking, and neither number is evidence of a trend in either direction.
Quoted prices identical to the earlier reading, our own daily dump
| Gap | Products with both readings | Identical to the cent | Share |
|---|---|---|---|
| 1 day (September 21 to 22, 2026) | 52,266 | 45,056 | 86.2% |
| 4 days (September 18 to 22, 2026) | 52,086 | 37,981 | 72.9% |
| 7 days (August 31 to September 7, 2026) | 51,756 | 26,853 | 51.9% |
| 23 days (August 30 to September 22, 2026) | 51,496 | 17,756 | 34.5% |
A number that moved is not a number that learned
Put the two tapes on the same cards over the same four days, on the only window where both have complete coverage, and you get the measurement that matters. 25,938 card-and-grade pairs across 10,653 cards carry a quoted price on both September 18 and September 22, 2026 and a sold tape on every day between. The quote moved on 15,016 of them. On 11,794 of those, 78.5%, the sold tape added no verified sale at all across the same four days.
Did the quote move, and did any new sale happen? 25,938 card-and-grade pairs
| New verified sale recorded | No new verified sale | Total | |
|---|---|---|---|
| Quote moved | 3,222 | 11,794 | 15,016 |
| Quote frozen | 1,521 | 9,401 | 10,922 |
| Total | 4,743 | 21,195 | 25,938 |
The top-right cell is the one to keep. It is the largest cell in the table and it describes a price that changed on a screen while nothing changed in the world we can observe. The bottom-left cell, 1,521 pairs, is the opposite error: a sale happened and the quote did not notice. And the bottom-right, 9,401 pairs or 36.2% of the sample, is a card where absolutely nothing was learned for four days on either instrument, while the page still rendered a price and a change.
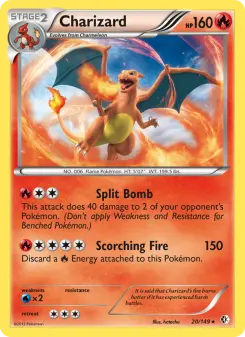
At the card level rather than the series level the same shape holds: of 10,653 cards, 5,310 repriced, and on 3,443 of those, 64.8%, no tracked grade recorded a new sale. Some named cases, all English, all carrying at least twenty verified comps behind the deepest sold median we hold for them, and not one of those comps new on ANY tracked grade in those four days: Charizard from Boundaries Crossed on 26 verified PSA 9 comps, quote $53.30 to $39.65, down 25.6%. Salamence ex from Journey Together on 100 verified PSA 10 comps, down 16.0%. Toxtricity from Phantasmal Flames on 215 comps, down 14.0%. Inteleon from Mega Evolution on 259 comps, down 20.4%. The test is strict, and one famous near-miss shows what it excludes: Kingdra from Aquapolis, the trophy at the centre of The $7,500 Card That Trades Four Times a Year, fell 23.9% over the same four days but is NOT on this list, because a single PSA 10 sale did land and took its graded median from $7,543.75 on 7 comps to $13,800.00 on 8.
Three questions that separate a price from a rumour
First: how many verified sales are behind this number? Under ten and the quote is an order of magnitude, for the reasons set out in How Many Sales Does a Pokémon Card Price Need. Second: has that count gone up recently? A median standing on 40 sales none of which are new is an older number than a median standing on 8 that gained 3 this week. Third: is the number you are reading a sold median or an ask? If it moved and no sale was recorded, it was an ask being re-quoted, and our ask-versus-sold study puts a size on how far an ask can sit from a sale. A display that answers all three has told you the age of its evidence, which is the only thing that separates a price from a rumour. On this tape, two sold medians in three could not answer the second question at all.
What would overturn this
The load-bearing assumption is that an unchanged comp count means no new recorded sale. It would be wrong if the provider's pool were a trailing window in which arrivals and departures cancelled, and the test for that is simple: if counts fall as often as they rise, the assumption is dead. In our whole recorded history they fall on 194 of 221,817 consecutive-day pairs, 0.09%, and all the large falls are our own printing-verification rebuilds. If a future window shows counts falling routinely, every share in this study is an overstatement and the piece should be withdrawn. Separately, if a longer tape shows the 78.5% figure collapsing toward the 34.5% base rate of frozen quotes, the joint result was a four-day artifact.
What this study cannot show
Our daily price tape is 23 days old, August 30 to September 22, 2026, and the dense daily graded tape is eight days old. Nothing here can speak to a 30-day, 90-day or annual staleness rate, and we have not tried. The joint test runs over four days for one reason only: those are the days on which both tapes have full coverage, and a longer joint window would be measured against a sync that only reached two thirds of the catalog. "No new verified sale" means none reached our record, which is not proof none happened. The sold tape is graded only; raw sales are invisible to it. And the 78.5% figure is computed on cards that have a graded tape at all, which is a minority of the catalog and a more actively traded minority than the rest, so the true catalog-wide share is very likely higher, not lower.
Sources: `graded_snapshots` (card key, grade, UTC day, median, sample_size) and `price_history` (product, day, price). Sold-side window: days 20711 to 20718 (September 15 to September 22, 2026), the 25,022 series present on all eight. Quoted-side windows: day pairs 20717/20718, 20714/20718, 20696/20703, 20695/20702 and 20695/20718, restricted to products carrying a reading on both days; days 20704 to 20713 are excluded from every pairing because the export sync truncated on them and covered 35,700 to 50,400 of roughly 52,300 products, which is a coverage artifact, not a price stratum. Joint test: days 20714 to 20718, where both tapes are complete, 25,938 card-and-grade pairs across 10,653 cards joined on the catalog's marketplace product id. Both sides of the joint test use the SAME four days: the comp delta is measured from day 20714 to day 20718, not from the start of the eight-day sold panel, and the pairs are deduped on (product, grade), which collapses nothing here because no two catalog rows in this cohort share a product id and a grade. "New verified sale" means the sample_size on the last day exceeds the sample_size on the first; ties and the zero falls are counted as no new sale. The joint cohort keeps only graded series whose card key is a marketplace product id our catalog carries, which is 11,701 of the 12,449 keys on the tape; without that restriction the same test runs over 27,315 pairs and reads 78.9%, so the join narrows the population without moving the result. COMP-DEPTH BANDS IN THE SEVEN-DAY TABLE ARE CUT ON THE SAMPLE SIZE ON DAY 20718, the last day of that window, so the six bands partition all 25,022 series exactly once; cutting on the first day instead puts 6,849 series in the 3-to-4 row at 87.8% and leaves every band in the same order. "Identical" means equal to the cent. Day 20719 exists in the graded table and is excluded because it was still being written. Quoted prices are ASKS. Graded medians are SOLD medians. An absent row is not recorded, never zero. Not financial advice.