A set's reputation is built by its best card. Its value is built by how many cards clear the bar where money starts. We counted, for each of 129 English sets, how many of its priced cards ask $100 or more on September 22, 2026. Skyridge has 42 of 178. Aquapolis has 39 of 185. Base Set has 3 of 101, Evolving Skies has 13 of 237 and 151 has 3 of 207. The median set in the universe has four. These are asks on one day, and the first thing a sceptic asks is whether a count like this wobbles day to day, so we recounted it on all fifteen complete daily dumps we hold between August 30 and September 23. Thirteen of the top fourteen sets move by three cards or fewer across the whole window, and six of them do not move at all.
Cards asking $100 or more. Ranks 1 to 14 of 129 English sets
Ranks 1 to 14 of 129, by the count of cards asking $100 or more. Asks on 2026-09-22, 18,698 priced products
| # | Set | Released | Cards at $100+ | Share of the set | Cards at $25+ | Priced cards | Set total |
|---|---|---|---|---|---|---|---|
| 1 | Skyridge | 2003 | 42 | 23.6% | 104 | 178 | $20,520 |
| 2 | Aquapolis | 2003 | 39 | 21.1% | 77 | 185 | $17,517 |
| 3 | Expedition Base Set | 2002 | 26 | 15.8% | 63 | 165 | $9,858 |
| 4 | Unseen Forces | 2005 | 21 | 17.9% | 33 | 117 | $11,209 |
| 5 | Delta Species | 2005 | 20 | 17.7% | 35 | 113 | $7,674 |
| 6 | Neo Destiny | 2002 | 19 | 16.8% | 35 | 113 | $10,269 |
| 7 | Cosmic Eclipse | 2019 | 19 | 7.0% | 45 | 271 | $6,503 |
| 8 | Team Rocket Returns | 2004 | 18 | 16.5% | 34 | 109 | $10,931 |
| 9 | Call of Legends | 2011 | 17 | 16.0% | 34 | 106 | $7,546 |
| 10 | Team Up | 2019 | 17 | 8.7% | 34 | 196 | $11,383 |
| 11 | Unified Minds | 2019 | 15 | 5.8% | 32 | 258 | $4,703 |
| 12 | Dragon Frontiers | 2006 | 13 | 13.0% | 21 | 100 | $7,237 |
| 13 | Evolving Skies | 2021 | 13 | 5.5% | 27 | 237 | $8,160 |
| 14 | Dragon | 2003 | 12 | 12.0% | 22 | 100 | $4,232 |
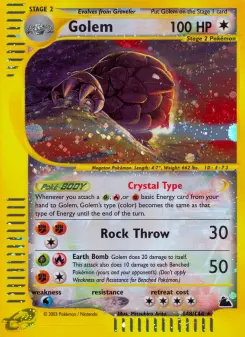
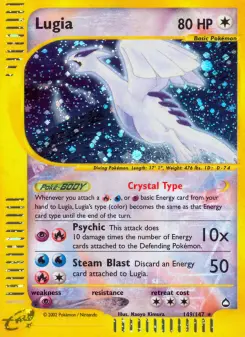
The e-Card era owns the top three. Skyridge, Aquapolis and Expedition Base Set were printed in 2002 and 2003, sold badly at the time, and hold 107 of the universe's 782 cards at $100 or more between them. They are also the three deepest $25 tiers we measure: 104 of Skyridge's 178 cards ask $25 or more, 77 of Aquapolis's 185 and 63 of Expedition's 165, against 45 for the next set on that measure, Cosmic Eclipse. That is a different kind of set from anything printed since. The reason those three names are so lightly traded in slabs is measured separately in 14,466 Cards With a Price and No Sale, where Aquapolis ranks sixth of 107 on cards asking real money with no recorded graded sale.
The genuinely unexpected row is seventh. Cosmic Eclipse, a 2019 Sun and Moon set that is remembered mostly as the end of an era, holds 19 cards asking $100 or more, more than Evolving Skies with 13, more than Prismatic Evolutions with 12, and more than six times Base Set with 3. Team Up has 17 and Unified Minds 15. Those three 2019 sets have very large checklists with deep rainbow and secret tiers, so their share of the set is small, between 5.8% and 8.7%, while their count is large. If you want a binder page of $100 cards rather than one $900 card, the 2019 Sun and Moon sets are where the most of them are, and they are the same sets that came 83rd, 84th and 89th of 90 on the PSA 10 premium in The PSA 10 Premium, Ranked Across 90 Sets, Cosmic Eclipse, Unified Minds and Team Up in that order.
The three ways this is wrong
First objection: a $100 line on asks will flicker, and you chose the day that suits you. This is the objection with the most teeth, because vintage asks on thin cards do jump. So the count was rerun on every complete daily dump we hold. Over the fifteen complete days from August 30 to September 23, Expedition Base Set, Unseen Forces, Team Up, Unified Minds, Dragon Frontiers and Evolving Skies did not move by a single card. Skyridge ran 40 to 42, Aquapolis 36 to 39 and Call of Legends 14 to 17. Exactly one of the fourteen moved more than three: Neo Destiny fell from 24 to 19 on September 7, which is the day the feed changed which printing of each Wizards-era vintage card it quotes, documented in How Concentrated Is the Pokémon Card Market. Eight of the fifteen days sit before that step and seven on or after it, and the count is stable within each side. The whole check is in the table below rather than only in this paragraph.
The stability check: the same count on each of the fifteen complete daily dumps, 2026-08-30 to 2026-09-23
| Set | Lowest | 2026-09-22 | Highest | Spread | One of the nine sets re-quoted on 2026-09-07 |
|---|---|---|---|---|---|
| Skyridge | 40 | 42 | 42 | 2 | no |
| Aquapolis | 36 | 39 | 39 | 3 | no |
| Expedition Base Set | 26 | 26 | 26 | 0 | no |
| Unseen Forces | 21 | 21 | 21 | 0 | no |
| Delta Species | 19 | 20 | 20 | 1 | no |
| Neo Destiny | 19 | 19 | 24 | 5 | yes, 24 to 19 |
| Cosmic Eclipse | 18 | 19 | 19 | 1 | no |
| Team Rocket Returns | 16 | 18 | 18 | 2 | no |
| Call of Legends | 14 | 17 | 17 | 3 | no |
| Team Up | 17 | 17 | 17 | 0 | no |
| Unified Minds | 15 | 15 | 15 | 0 | no |
| Dragon Frontiers | 13 | 13 | 13 | 0 | no |
| Evolving Skies | 13 | 13 | 13 | 0 | no |
| Dragon | 11 | 12 | 12 | 1 | no |
Second objection: this just ranks old sets. Partly. The rank correlation between a set's age and its $100 count is +0.489 across the 129 sets, which is a real but loose relationship, and the top fourteen contains four sets released after 2018. The stronger reading is that the correlation is far from 1: Base Set at rank 68 and Jungle at rank 101 are older than everything in the top eight and hold 3 and 1. Age is not the mechanism. Print run and checklist structure are, which is the argument Does Set Size Change What a Pokémon Set Is Worth and Pokémon Set Value by Era both circle.
Third objection: big sets have more of everything, so a count favours a 271-card checklist over a 101-card one. True, which is why the share column is in the table beside the count and why the chart's ordering is by count with ties broken on share. Read the two together and the two kinds of set separate cleanly. Skyridge is 42 cards and 23.6%, a set that is expensive all the way down. Cosmic Eclipse is 19 cards and 7.0%, a big checklist with a deep top. Neither is better. They are different objects, and a ranking that only printed the share would put Skyridge first and Cosmic Eclipse 34th, which would hide the finding rather than show it.
What would overturn this
Run the same count at $250 and at $50. If the ordering is a real property of these sets it should survive both moves, and if Skyridge and Aquapolis only lead at exactly $100 then the threshold is doing the work. The second test is the one that would hurt: recount on sold prices wherever a graded sold median exists. On the e-Card sets that will thin the top out sharply, because those are precisely the sets where a large share of cards asking real money have no recorded graded sale. The prediction this study is willing to make is that Skyridge stays first on asks and loses its lead on sales, and the measurement that would settle it does not exist yet.
As of `price_history` day 20718, which is 2026-09-22. Universe as in every study in this wave: English catalogue rows with a TCGplayer product id, one row per product id after collapsing 240 duplicates, priced on day 20718, in a set carrying a recorded release date and holding 60 or more such products: 129 sets, 18,698 products. A card counts when its ask is $100.00 or more; 782 do, 4.2% of the universe, and 13 of the 129 sets hold none. Prices are TCGplayer market prices for the flagship printing and are ASKS, not sold prices. The ranking is by count, with ties broken by the higher share of the set ranking first, which is what separates ranks 6 and 7 (both 19) and ranks 9 and 10 (both 17). Ranks 1 to 14 are printed contiguously; the full ordered 129 is in the scratch dump. The stability check, printed in full as the second table, recounts the same fixed list of product ids per set on each of the fifteen COMPLETE daily dumps between day 20695 and day 20719: days 20704 to 20713 are partial catalogue dumps carrying 35,700 to 50,400 rows against roughly 52,000 on a full day, and are excluded for that reason rather than for their values. The rank correlation between age and count is Spearman with tied ranks averaged, over all 129 sets, with age taken from the recorded release date. Five sets in the printed table appear unlinked because no set page renders their own card list. Four of them, Unseen Forces, Delta Species, Team Rocket Returns and Dragon Frontiers, have no page at all. The fifth is Dragon, meaning the 2003 EX-era set: `/set/dragon` returns 200 but renders Dragon Majesty's price series over EX Dragon's card list, so that row is left unlinked rather than pointed at a page that is not it. Scripts: apps/web/scripts/rs-figures.mts and rs-extra.mts; figures in apps/web/.scratch-reddit-sets/figures.json. Nothing here is investment advice.