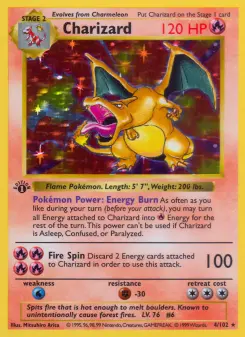
A PSA 10 multiple is the graded sold median divided by the raw ask, and the multiple you have heard quoted is somewhere around ten. That average is made of set-level numbers that run from 120.98x down to 5.26x. Across 4,100 cards that carry both a raw ask on September 22, 2026 and a PSA 10 sold median recorded by the same date on three or more verified eBay sales, grouped into the 90 sets holding twelve or more of them, the median card in Fossil sells for 120.98x its ask in a PSA 10 and the median card in Unbroken Bonds for 5.26x. Two caveats come before the number, because a Fossil card is not four times as gradeable as it was a month ago. The first is that on September 7, 2026 the price feed re-quoted nine Wizards-era sets onto a different printing, which cut the denominator under nine of the twelve sets at the top of this table: on the last day before that step Fossil read 35.28x, not 120.98x. The sceptic's section below opens with it. The second is selection: a card enters only if somebody has already graded it and sold the 10. Cards nobody grades have no multiple and are not here. What this ranks is the sets where grading a card that people grade pays best, which is a narrower claim than it sounds and still a useful one.
Raw is an ask, graded is a sale
The numerator and the denominator come from different places and mean different things. The denominator is a TCGplayer market price for the flagship printing on one day: an ASK, what a seller wants. The numerator is our recorded eBay PSA 10 median: a SOLD price, what buyers paid, written only when at least three verified sales support it. A multiple built from the two is therefore not a spread you can capture, it is the distance between a listing and a trade with a grading round in between. Ask Versus Sold is the piece on that gap by itself. Two sibling studies published alongside this one measure the same premium on different cuts: How Much a PSA 10 Adds, Across 8,676 Cards does it card by card and finds the middle card at 12.20x, and The Multiple Ladder shows the multiple falling with the price tag. Neither ranks sets, which is what this one does.
Median PSA 10 multiple by set. The twelve highest and the twelve lowest of 90
Ranks 1 to 12 of 90, by the set's median PSA 10 multiple
| # | Set | Median multiple | Median raw ask | Median PSA 10 sold | Qualifying cards | Verified PSA 10 sales behind them |
|---|---|---|---|---|---|---|
| 1 | Fossil | 120.98x | $5.48 | $475.00 | 43 of 62 | 1,145 |
| 2 | Jungle | 100.11x | $5.24 | $337.50 | 43 of 64 | 1,173 |
| 3 | Team Rocket | 86.72x | $6.91 | $350.35 | 62 of 83 | 1,106 |
| 4 | Neo Genesis | 79.01x | $7.38 | $550.40 | 21 of 111 | 175 |
| 5 | Neo Discovery | 63.30x | $8.93 | $297.47 | 38 of 75 | 250 |
| 6 | Gym Heroes | 51.93x | $26.99 | $1,425.00 | 15 of 132 | 191 |
| 7 | Power Keepers | 45.23x | $54.60 | $2,162.00 | 23 of 108 | 245 |
| 8 | Gym Challenge | 44.55x | $10.65 | $490.00 | 64 of 132 | 475 |
| 9 | Base Set | 43.24x | $19.07 | $367.00 | 16 of 101 | 92 |
| 10 | Neo Revelation | 40.07x | $7.58 | $250.75 | 37 of 66 | 234 |
| 11 | FireRed & LeafGreen | 37.92x | $37.60 | $1,328.44 | 25 of 116 | 193 |
| 12 | Neo Destiny | 36.12x | $26.11 | $574.76 | 55 of 113 | 454 |
All twelve of the top twelve were released before 2008 and ten are Wizards-era. The mechanism is not mysterious: a 1999 card that survived twenty-seven years of binders, rubber bands and play is almost never mint, so the 10 is rare and the raw copy is cheap. What is less obvious is the size of the gap between neighbours in the same era. Fossil is 120.98x and Base Set is 43.24x, a factor of nearly three between two sets printed nine months apart. Part of that is what a raw Base Set card asks, which is higher, and part is that Base Set's qualifying cards are only 16 of its 101, the second thinnest coverage in the top twelve behind Gym Heroes at 15 of 132.
Ranks 79 to 90 of 90, the same measure, lowest last
| # | Set | Median multiple | Median raw ask | Median PSA 10 sold | Qualifying cards | Verified PSA 10 sales behind them |
|---|---|---|---|---|---|---|
| 79 | Celestial Storm | 7.80x | $32.36 | $305.50 | 25 of 183 | 252 |
| 80 | Evolving Skies | 7.47x | $9.48 | $77.79 | 98 of 237 | 9,758 |
| 81 | Chilling Reign | 7.24x | $8.84 | $57.75 | 82 of 233 | 3,437 |
| 82 | Ultra Prism | 7.03x | $27.49 | $168.94 | 33 of 173 | 242 |
| 83 | Cosmic Eclipse | 6.71x | $42.53 | $297.58 | 65 of 271 | 1,538 |
| 84 | Unified Minds | 6.36x | $45.03 | $299.98 | 49 of 258 | 1,189 |
| 85 | Sword & Shield | 6.05x | $12.47 | $59.72 | 22 of 216 | 194 |
| 86 | Hidden Fates Shiny Vault | 5.93x | $12.39 | $75.00 | 94 of 94 | 3,595 |
| 87 | Shrouded Fable | 5.76x | $17.67 | $73.00 | 36 of 99 | 2,198 |
| 88 | Prismatic Evolutions | 5.53x | $17.30 | $89.99 | 58 of 180 | 8,608 |
| 89 | Team Up | 5.43x | $63.41 | $337.83 | 43 of 196 | 1,050 |
| 90 | Unbroken Bonds | 5.26x | $47.20 | $235.62 | 45 of 234 | 1,058 |
This is the half of the table that costs people money. Prismatic Evolutions sits 88th of 90 on 58 qualifying cards and 8,608 verified PSA 10 sales, the eighth deepest sale record of the 90, so this is not a thin-data ranking. Evolving Skies is 80th on 9,758 verified sales behind 98 cards, the sixth deepest. The deepest of all belongs to Mega Evolution at 19,860 sales, and it ranks 70th. The six deepest sale records in the study are Mega Evolution at rank 70, Ascended Heroes at 77, Phantasmal Flames at 38, Destined Rivals at 57, Crown Zenith Galarian Gallery at 53 and Evolving Skies at 80, so one of the six sits in the bottom eleven and five of the six sit in the bottom half. The reason is on the same rows: their raw asks are already high relative to what the 10 sells for, because everybody already graded them. Is Grading Pokémon Cards Worth It runs the same decision as a fee-netted expected value rather than a multiple, and The Grading Frontier shows what the PSA 9 does to it.
The four ways this is wrong
First objection, and the one that moves the headline furthest: the vintage denominators were re-quoted a fortnight ago. On September 7, 2026 the price feed changed which printing it quotes for nine Wizards-era sets at once, and nine of the twelve sets at the top of this table are those nine: Fossil, Jungle, Team Rocket, Neo Genesis, Neo Discovery, Gym Heroes, Gym Challenge, Neo Revelation and Neo Destiny. The multiple is a sold median over a raw ask, so cutting the ask multiplies it. Run this identical ranking on day 20702, the last day before the step, holding the same sold medians, and Fossil reads 35.28x rather than 120.98x, Jungle 29.04x rather than 100.11x and Neo Genesis 31.23x rather than 79.01x. The top of that pre-step table is Power Keepers at 45.49x and Base Set at 43.48x, neither of which was re-quoted and neither of which moved: they read 45.23x and 43.24x today. So 120.98x is what a Fossil card's recorded PSA 10 sale is worth against the ask we publish today, and it is not what it was worth against the ask we published three weeks ago. The vintage-high, modern-low shape survives the step, because Power Keepers and Base Set led the pre-step table too. The specific size of the vintage premium does not. Quote the shape, and quote 120.98x only with this paragraph attached. The event itself is documented in How Concentrated Is the Pokémon Card Market and its effect on bulk in Which Pokémon Sets Are Mostly Bulk.
Second objection, and the strongest on the method: the multiple is just the price tag. Cheap cards have big multiples, vintage sets have cheap cards, so this ranks age. Within the whole panel that is exactly what happens, and we print it: the median multiple falls from 46.74x under $1 to 8.80x in the $25 to $100 band, then ticks back up to 11.23x above $100, which is the same shape The Multiple Ladder found when it walked the bands in powers of two. But it does not explain the SET ordering. The rank correlation between a set's median qualifying raw ask and its median multiple is +0.095 across the 90 sets, which is nothing. The table proves it directly. Fossil at $5.48 median ask reads 120.98x and Journey Together, not shown above but at $3.97, reads 13.30x. Power Keepers at $54.60 reads 45.23x and Team Up at $63.41 reads 5.44x. Two sets whose median qualifying card asks within 14% of each other are eight times apart on the multiple.
The price control: median multiple by raw price band, all 4,100 qualifying cards
| Raw ask band | Cards | Median multiple | Median cash gap |
|---|---|---|---|
| Under $1 | 127 | 46.74x | $39.70 |
| $1 to $5 | 1,163 | 23.73x | $51.04 |
| $5 to $25 | 1,472 | 11.42x | $106.51 |
| $25 to $100 | 839 | 8.80x | $345.25 |
| $100 and up | 499 | 11.23x | $2,647.50 |
Third objection: three verified sales is not a market. Agreed, so we re-ran the entire ranking at a floor of 25 verified sales, which cuts the panel from 4,100 cards to 1,502 and the qualifying sets from 90 to 42. The ordering holds at both ends and the middle reshuffles. Jungle is first at 231.00x on 15 cards and Fossil second at 120.98x on 17; the bottom five become Shrouded Fable at 5.02x, Evolving Skies at 4.60x, Prismatic Evolutions at 4.17x, Hidden Fates Shiny Vault at 3.58x and Chilling Reign at 2.74x. So the vintage-top, modern-bottom shape is not an artefact of thin comps. The specific last place is: at three sales it is Unbroken Bonds, at 25 sales it is Chilling Reign. Quote the shape, not the wooden spoon.
Fourth objection, and this one is not fully answerable: survivorship. A card enters only if it has a PSA 10 sold median, which means somebody graded it, got the 10, and sold it. On a vintage set, the cards that clear that bar are the ones worth submitting, and the ones that were not worth submitting have no multiple and no row. Fossil contributes 43 of its 62 priced cards, Base Set only 16 of 101, and those two coverage rates are not the same study. The direction of the bias is knowable even if the size is not: the missing cards are the ones with the worst case for grading, so every set's true all-cards multiple is below its printed one, and the effect is largest where coverage is thinnest. That is why the qualifying-cards column is in the table rather than in a footnote.
What would overturn this
Three observations would break it. A set-level ranking that inverts when each set's cards are matched to cards of the same raw price in another set would mean the set effect is price after all, and the +0.095 rank correlation says it is not, but a matched-pair test is stronger than a correlation and has not been run. A widening of coverage that pulls the vintage medians down toward the modern ones would mean the gap was survivorship: the test is to watch Base Set as its qualifying count rises above 16 of 101 and see whether 43.24x falls. And a change in PSA's own throughput or grading standards would move the numerator on every row at once, which The Gem Rate Drift is the piece that watches for.
As of `price_history` day 20718, which is 2026-09-22, for every raw price, and the latest `graded_snapshots` row per card and grade for every sold median, read across both the catalogue card id and the TCGplayer product id exactly as src/server/card-facts.ts does, with the more recent day winning per grade. THE GRADED READ IS PINNED TO THE SAME DAY AS THE PRICES, `graded_snapshots` rows with day <= 20718, because that tape is appended every day and an unpinned latest-row read is not reproducible: reading it a day later moves the panel to 4,102 cards, Fossil's median to 140.06x and the whole-panel median to 15.31x, none of which a reader could get back. Both instruments here are therefore as of 2026-09-22 and nothing later. The graded cron writes a median only when three or more verified eBay sales support it (MIN_SAMPLE = 3 in src/app/api/cron/graded-snapshot/route.ts), so the three-sale floor is the tape's own write rule, not a filter applied here; 4,100 of the universe's 18,698 products carry both a raw ask and a PSA 10 median, and the whole English priced catalogue carries 4,675. Multiple is the PSA 10 sold median divided by the raw ask. Raw prices are TCGplayer market prices for the flagship printing and are ASKS; graded medians are SOLD prices. A set enters the ranking with twelve or more qualifying cards: 90 of the universe's 129 sets. The ranking is printed as two contiguous slices, ranks 1 to 12 and ranks 79 to 90, and the chart shows those same 24 rows; the full ordered 90 is in the scratch dump. Ties are broken by the larger qualifying-card count ranking first; no tie occurs inside either printed slice. Medians take the upper-middle value on even samples. The deep-comp re-run raises the write floor to 25 verified sales, which leaves 1,502 cards and 42 sets with twelve or more, and its whole-panel median multiple is 8.80x against 15.30x on the full panel. Rank correlations are Spearman with tied ranks averaged. The price-band table is over all 4,100 qualifying cards, not over sets. Nine of the twelve sets in the top slice had every raw ask re-quoted onto a different printing on 2026-09-07, sixteen days before the cross section; the pre-step comparison in the sceptic section reruns the whole ranking on day 20702 asks against the same sold medians, so only the denominator changes. FireRed & LeafGreen appears unlinked because that set has no set page. Nothing here nets a grading fee, a shipping cost or a gem rate; it is a price ratio, not a return. Scripts: apps/web/scripts/rs-figures.mts; figures in apps/web/.scratch-reddit-sets/figures.json. Nothing here is investment advice.