The rarity symbol in the corner of a Pokemon card is a printing instruction, not a price. Across **21,435 priced English printings** on September 23, 2026, the step from Common to Uncommon is worth **1.11x**, and **46.05%** of commons are priced above the uncommon median. At the other end of the ladder the step from Special Illustration Rare to Secret Rare runs backwards, at 0.30x across the whole catalog and 0.06x inside the current era.
That is the finding. The rest of this study is the chart itself: how many cards carry each printed label, what each tier's ask distribution looks like, and which rungs of the ladder are real.
The chart
Thirty-seven distinct values, 35 of them labels actually printed on a card plus a blank and the literal "None", fold into eleven buyer-facing tiers. The mapping is stated in the methodology so you can disagree with a specific line of it. Prices are asks.
Rarity tiers by count and ask distribution
| Tier | Cards | Share of catalog | 25th | Median | 75th | 90th | Under $1 | $100 or more |
|---|---|---|---|---|---|---|---|---|
| Common | 6,210 | 28.35% | $0.15 | $0.27 | $0.79 | $5.00 | 78.10% | 0.97% |
| Uncommon | 4,944 | 22.57% | $0.16 | $0.30 | $1.04 | $3.64 | 74.54% | 0.04% |
| Rare | 3,859 | 17.61% | $0.39 | $2.03 | $13.30 | $70.83 | 39.88% | 7.74% |
| Ultra Rare | 2,450 | 11.18% | $1.28 | $3.82 | $19.04 | $84.17 | 19.28% | 8.64% |
| Promo | 1,182 | 5.40% | $1.81 | $5.93 | $18.56 | $54.49 | 16.12% | 5.34% |
| Secret / Hyper Rare | 777 | 3.55% | $4.58 | $10.50 | $34.58 | $142.38 | 10.81% | 13.13% |
| Holo Rare | 752 | 3.43% | $0.37 | $13.60 | $60.86 | $200.00 | 34.18% | 17.02% |
| No rarity printed | 640 | 2.92% | $0.69 | $5.35 | $14.94 | $52.67 | 28.08% | 7.31% |
| Illustration Rare | 500 | 2.28% | $6.15 | $12.25 | $22.83 | $41.58 | 0.00% | 0.80% |
| Shiny / Radiant | 362 | 1.65% | $2.51 | $4.42 | $10.17 | $21.13 | 1.66% | 2.49% |
| Special Illustration Rare | 232 | 1.06% | $19.29 | $35.21 | $75.33 | $190.52 | 0.00% | 19.65% |
Half the English catalog, 11,154 cards, is Common or Uncommon, and three quarters of those are priced under a dollar. The tier holding the most value is not a chase tier at all: it is **Rare**, at 33.93% of the summed ask of the whole catalog, because there are 3,859 of them and the old ones are expensive. Two tiers have a floor under them: not one of the 499 priced Illustration Rares and not one of the 229 priced Special Illustration Rares sits under a dollar.
Median ask by rarity tier
The ladder, rung by rung
A rung is real when the tier above is dearer and the two distributions do not sit on top of each other. The overlap column is the share of the lower tier priced above the upper tier's median: 0% would be a clean break, 50% would be no information at all.
Every step of the printed rarity ladder
| Step | Priced cards | Median multiple | Lower tier above upper median | Verdict |
|---|---|---|---|---|
| Common to Uncommon | 6,063 / 4,901 | 1.11x | 46.05% | Not a step |
| Uncommon to Rare | 4,901 / 3,811 | 6.77x | 16.34% | Real |
| Rare to Holo Rare | 3,811 / 752 | 6.70x | 24.64% | Real |
| Holo Rare to Ultra Rare | 752 / 2,443 | 0.28x | 61.70% | Inverted, see below |
| Ultra Rare to Illustration Rare | 2,443 / 499 | 3.21x | 29.96% | Real |
| Illustration Rare to Special Illustration Rare | 499 / 229 | 2.87x | 13.23% | Real |
| Special Illustration Rare to Secret Rare | 229 / 777 | 0.30x | 90.83% | Inverted |
The Holo Rare inversion is an era artefact and should be read as one. Our Holo Rare tier is dominated by vintage holos from Base Set through Skyridge, while Ultra Rare is dominated by modern V and ex cards printed in the hundreds of thousands. Inside a single era the rung behaves: in the Sword & Shield era the Holo Rare to Ultra Rare step is 7.74x on 265 against 734 cards, and in the Diamond and Pearl era it is 5.29x on 244 against 106.
The Special Illustration Rare inversion is not an era artefact. Inside the current era alone it is 0.06x, and all 229 priced Special Illustration Rares sit above that era's Secret and Hyper Rare median.
The top of the modern ladder is upside down
Special Illustration Rare against Secret and Hyper Rare, current-era sets
| Set | SIRs priced | SIR median | Secret/Hyper priced | Secret/Hyper median | Step |
|---|---|---|---|---|---|
| Prismatic Evolutions | 32 | $49.60 | 5 | $7.86 | 0.16x |
| Paldea Evolved | 15 | $17.88 | 9 | $6.18 | 0.35x |
| Paradox Rift | 15 | $15.73 | 7 | $3.08 | 0.20x |
| Twilight Masquerade | 11 | $34.79 | 6 | $7.54 | 0.22x |
| Surging Sparks | 11 | $29.43 | 6 | $10.22 | 0.35x |
| Destined Rivals | 11 | $60.90 | 6 | $22.24 | 0.37x |
| Temporal Forces | 10 | $47.25 | 6 | $10.91 | 0.23x |
| Scarlet & Violet | 10 | $12.85 | 6 | $5.79 | 0.45x |
| Paldean Fates | 8 | $26.29 | 6 | $11.19 | 0.43x |
| Shrouded Fable | 5 | $25.84 | 5 | $21.38 | 0.83x |
| ME05: Pitch Black | 6 | $50.30 | 100 | $0.15 | 0.00x |
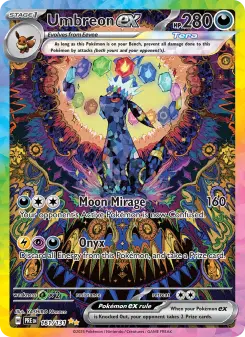
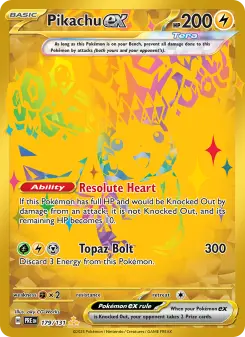
Eleven sets, eleven inversions. The last row is not a chase comparison at all: ME05: Pitch Black prints the label "Secret" on 99 of its cards, so its Secret tier is the set floor rather than its ceiling. The other ten are ordinary sets. The clearest case is Prismatic Evolutions, where Umbreon ex is a Special Illustration Rare asking $1,412.72 while Pikachu ex, a hyper rare one rung higher on the printed ladder in the same set, asks $61.96. The printed hierarchy says gold beats art. The market says art beats gold, in all eleven current-era sets holding at least five priced cards on each side. That is the direction The Scarcity Tax found on returns and The Art Floor found on foil tiers, measured here as a census of the catalog rather than a sample of sets.
The first rung has never worked
The Common to Uncommon step inside each era
| Era | Commons / Uncommons priced | Step | Commons above the uncommon median |
|---|---|---|---|
| WotC 1999-2003 | 640 / 482 | 1.28x | 45.16% |
| EX 2003-2007 | 598 / 541 | 1.66x | 33.61% |
| Diamond & Pearl to HGSS 2007-2011 | 766 / 599 | 1.07x | 47.91% |
| BW and XY 2011-2017 | 1,157 / 906 | 1.13x | 41.75% |
| Sun & Moon 2017-2019 | 725 / 681 | 1.04x | 42.62% |
| Sword & Shield 2020-2022 | 709 / 713 | 1.00x | 45.84% |
| SV and Mega 2023-2026 | 1,443 / 968 | 1.08x | 41.93% |
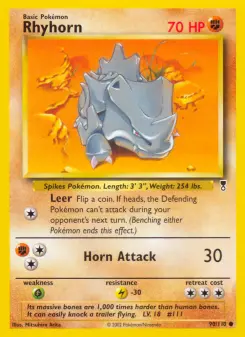
Seven eras, seven non-steps. In the Sword & Shield era the two tiers have the same median to the cent. Compared set by set, across the 126 English sets holding at least ten priced cards in each tier, the common median is higher than the uncommon median in 21 of them, 16.67%. The rarity symbol distinguishes a one-dot card from a two-dot card, and the market does not price the difference.
The vocabulary is growing faster than the ladder
Distinct values of the rarity field in each era
| Era | Distinct values | Cards |
|---|---|---|
| WotC 1999-2003 | 5 | 1,790 |
| EX 2003-2007 | 5 | 1,876 |
| Diamond & Pearl to HGSS 2007-2011 | 11 | 2,209 |
| BW and XY 2011-2017 | 9 | 3,849 |
| Sun & Moon 2017-2019 | 9 | 3,049 |
| Sword & Shield 2020-2022 | 17 | 3,689 |
| SV and Mega 2023-2026 | 21 | 4,922 |
Four times as many values as the WotC era, across a ladder whose rungs are no better separated. Some new labels describe genuinely different products: the Illustration Rare did not exist before 2022 and behaves like its own asset. Others are finishes on the same slot.
How deep the chase tier runs in a modern set
| Set | Cards | Illustration Rares | Special Illustration Rares | Secret/Hyper | Chase share |
|---|---|---|---|---|---|
| Ascended Heroes | 295 | 33 | 22 | 2 | 19.32% |
| Paldea Evolved | 279 | 36 | 15 | 9 | 21.51% |
| Paradox Rift | 266 | 34 | 15 | 7 | 21.05% |
| Scarlet & Violet | 258 | 24 | 10 | 6 | 15.50% |
| Surging Sparks | 252 | 23 | 11 | 6 | 15.87% |
| Paldean Fates | 245 | 3 | 8 | 6 | 6.94% |
| Destined Rivals | 244 | 23 | 11 | 6 | 16.39% |
| Obsidian Flames | 230 | 12 | 6 | 3 | 9.13% |
What this study cannot show
It cannot tell you print runs. Rarity is a printing instruction and the actual sheet counts are not published, so nothing here is a scarcity measurement. It reports what cards carrying each label ask today.
It uses asks, not sold prices. On a thin card the ask can sit above anything anybody has paid, and the tiers most exposed to that are the ones with the fewest cards. It also mixes eras inside each tier by design, which is what produces the Holo Rare inversion; the per-era tables exist so the mixing is visible rather than hidden.
And the tier mapping is a judgement. Folding "Double rare", "Holo Rare V" and "ACE SPEC Rare" into one Ultra Rare tier is defensible and not the only defensible choice. The dataset keeps all 37 labels separately for anyone who wants to cut them differently.
What would overturn it
Sold medians replacing asks and showing a Common to Uncommon step materially above 1.2x would overturn the first finding. A current-era set in which the Secret and Hyper Rares out-price the Special Illustration Rares, on at least five priced cards each side, would break the second: eleven sets tested, eleven inversions, and one clean counterexample makes it a tendency rather than a rule.
Population: the 21,908 distinct physical English printings defined in How Many Pokemon Cards Are There?, of which 21,435 carry a market ask on 2026-09-23. Rarity is the `rarity` field on the catalog row, as printed. Labels fold to tiers by a rule applied in this order: empty, null, "None" and "Code Card" are No rarity printed; anything containing "promo" is Promo; "special illustration" or "special art" is Special Illustration Rare; "illustration rare" or "art rare" is Illustration Rare; "hyper", "rainbow", "secret", "crown" or "gold" is Secret / Hyper Rare; "shiny", "shining", "radiant" or "amazing" is Shiny / Radiant; "ultra rare", "double rare", "triple rare", "futuristic", "classic collection", "pikachu rare", "jumbo", "ace spec", "prism", "legend", "prime", "break", "lv.x" or "holo rare v" is Ultra Rare; "holo" is Holo Rare; "uncommon" is Uncommon; "common" is Common; a remaining "rare" is Rare. Prices are TCGplayer market asks resolved by the site's own per-card rule. Medians are the upper-middle value on even samples. A ladder step is reported only when both tiers hold at least 20 priced cards in the population being cut, which is why several era rows in the underlying data are blank rather than estimated. The overlap column is the share of the lower tier priced strictly above the upper tier's median. The "Under $1" column is a strict comparison and the "$100 or more" column is inclusive of $100 exactly, which moves four tiers by a card or two against a strict reading. The label count of 37 counts distinct values of the `rarity` field: 35 printed labels, the empty string and the literal "None"; the per-era label table counts the same way, which is why every era row includes the blank. Value share sums asks across the tier and divides by the $454,030.46 summed ask of all 21,435 priced cards. No regression is run and no era is weighted.