The money is not where the famous sets are, and there is no single answer because there are two different questions hiding inside the phrase. On September 29, 2026, one of every card we price adds up to $892,584 across 52,433 products. The graded copies of the cards in these same sets, counted grade by grade against what that grade actually sells for, add up to $5.91 billion at the five-sale bar set out below. The ten costliest sets are 15.0% of the first figure and the ten richest in slabs are 30.1% of the second. Measured only against the part of each that we can attribute to a named set, which is $732,836 of cost and $5.81 billion of slabs, the ten costliest sets hold 18.3% and it takes fifty-nine sets to reach half, while the ten richest hold 30.6% and twenty-three sets reach half. Neither of those is the concentration the hobby usually talks about, and the two rankings are only moderately related: Spearman rank correlation is 0.60 across the 405 sets that appear in both, only three sets sit in both top tens, and 230 sets that cost real money to complete carry no measurable graded value at all.
Two numbers we can compute, and one we cannot
A market cap is a price multiplied by a supply. Pokemon has no supply figure. No print run, no circulation count and no total-copies column exists anywhere in what we hold, and `printed_total` is the number on the bottom of the card, the 195 in "139/195", not how many were made. So this study never uses the words market cap for a set, and neither should anyone quoting it. It uses two measures instead, each of which is a real thing a real person could go and do.
SET COST is the sum of one of each card, at the TCGplayer market price recorded for its standard printing on September 29, 2026. That is a market price derived from recent sales, not an asking price and not a comparable sale you can point at. It is what a reader pays to finish a checklist, and it was measured on a different day and a slightly different universe in What Completing a Set Actually Costs. Whole record: $892,583.54 across 52,433 products.
GRADED SEGMENT VALUE is every PSA 10 copy multiplied by that card's own PSA 10 sale price, plus every PSA 9 copy multiplied by its PSA 9 sale price, summed. It is the same form of arithmetic our earlier study called a graded market cap for a single card, run here over only the two grades our population data splits out, and the exclusion has to travel with the number every time: it counts only copies somebody paid to slab, it counts nothing raw, it counts nothing sealed, and PSA 1 through 8 has no per-grade population in our data, so 5,317,400 recorded copies are never multiplied by anything, and 172,388 of those sit on 2,878 registries carrying no PSA 9 reading at all, which makes their grade unknown rather than known to be 1 through 8. Total: $5,912,596,419 at the five-sale bar set out in the methodology.
How steep the curve actually is
The chart below is the answer to where the money lies, and it is the part of this study that argues with the question. Both shares are taken against the money that attributes to a named set: $732,836 of cost across 635 sets, $5.81 billion of slabs across 405. Both curves climb quickly and then keep climbing for a long time. On cost to complete, the first set is 3.7% and the first ten are 18.3%; half needs fifty-nine sets and 80% needs 171. On graded money the curve is half again to two-thirds again as steep across the first fifty sets and then converges on the cost curve: the first ten sets are 30.6%, half needs twenty-three sets, 80% needs eighty. At one set the graded share is 1.35 times the cost share, at twenty it is 1.69 times, at fifty it is 1.50 and at three hundred it is 1.07. So the two costliest sets out of 635 are not where this hobby sits. Reaching half of that attributed cost takes fifty-nine of them, and that is the measure where a reader actually buys one of each card.
Cumulative share of each measure, sets ranked from richest down
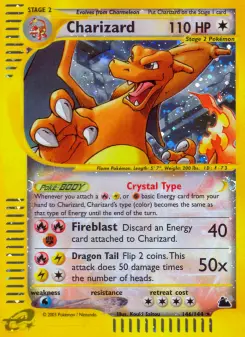
The gap between the two lines is the finding. Graded money pools into a short list of cards that a lot of people sent to PSA in the same eighteen months. Cost to complete spreads out, because a checklist is long and every card on it carries a price. Skyridge prices 177 cards with a median of $30.71 and a best card at $1,387.99, and it costs $19,514 to finish. Evolving Skies prices 237 cards with a median of 34 cents and a best card at $2,214.79, and it costs $8,063. The older set is more than twice the bill and holds a quarter of the graded money.
Ranked by what it costs to complete
This is the list a collector recognises: early 2000s e-Card sets where every slot is expensive, and promo bins that accumulate a decade of releases under one heading. The first set carrying a recorded release date of 2022 or later appears at rank 27, Ascended Heroes. Five of the 26 sets above it carry no recorded release date in the one release table we own, and the other 21 are dated between 1999 and 2021.
Cost to complete, top 12 of 635 sets. September 29, 2026
| Rank | Set | Cards priced | Set cost | Graded segment | Rank on graded |
|---|---|---|---|---|---|
| 1 | SM-P: Sun & Moon Promos (Japanese, promo bin) | 222 | $26,931 | $266.1M | 2 |
| 2 | Skyridge | 177 | $19,514 | $61.0M | 22 |
| 3 | Aquapolis | 183 | $17,669 | $31.3M | 45 |
| 4 | Team Up | 196 | $11,511 | $110.8M | 10 |
| 5 | Unseen Forces | 117 | $11,188 | $37.1M | 38 |
| 6 | Neo Destiny | 113 | $10,719 | $45.3M | 33 |
| 7 | Expedition Base Set | 165 | $9,605 | $14.9M | 94 |
| 8 | Pokemon VS (Japanese) | 149 | $9,456 | $3.9M | 183 |
| 9 | XY Black Star Promos (promo bin) | 209 | $9,103 | $19.3M | 68 |
| 10 | Evolving Skies | 237 | $8,063 | $251.8M | 3 |
| 11 | XY-P: XY Promos (Japanese, promo bin) | 149 | $7,770 | $87.3M | 18 |
| 12 | Team Rocket Returns | 109 | $7,693 | $15.5M | 89 |
Sets without a link either have no page on this site yet or are promo bins we do not give one, so they are named rather than linked. Era patterns across sets have their own study in Pokemon Set Value by Era, and the promo bins are discussed further down, because they are not sets and treating them as sets is how this ranking misleads.
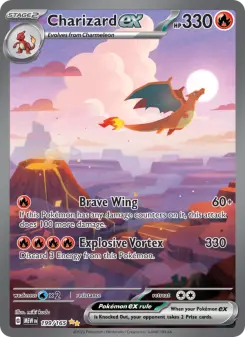
The list a collector expects is not this list, and the gap is the most useful thing on this page. Base Set holds the most famous card in the hobby and ranks 91st of 635 on what it costs to complete: $2,230 for the 101 of its 102 cards we price, 0.30% of the ranked cost. The card we cannot price is Machamp, which carries no product id, and at these margins that matters: another $37 of Base Set would move it to 90th. Base Set 2 is 127th. The reason is arithmetic rather than taste. A set costs what its cards cost added together, so there are two ways to be expensive and Base Set is neither. Skyridge takes the first: 177 slots priced at a median of $30.71, with 153 of them at $10 or more, so the cost is the whole checklist. Evolving Skies takes the second: its median card is 34 cents and 137 of its 237 cards are under a dollar, but the two at the top are $2,215 and $1,255, so a small handful in very large numbers carries it to tenth. Base Set has neither a hard checklist, at a median of $2.55, nor a handful big enough, with Charizard at $944. A famous card makes an expensive card. It takes a different thing again to make an expensive set.
Where the sets a collector names actually rank on cost to complete, of 635. September 29, 2026
| Rank | Set | Cards priced | Set cost | Share of ranked cost |
|---|---|---|---|---|
| 10 | Evolving Skies | 237 | $8,063.00 | 1.10% |
| 91 | Base Set | 101 | $2,230.43 | 0.30% |
| 127 | Base Set 2 | 130 | $1,636.55 | 0.22% |
That is a statement about completing a checklist and nothing else. On the graded measure below, where a single card's slab population carries the figure, Base Set moves a long way up, and the disagreement between the two rankings is the subject of the rest of this study.
Ranked by the money sitting in slabs
Now the same 635 sets, ranked on graded segment value. Six of these ten are promo bins and three are Japanese. Only Evolving Skies, Team Up and the SM-P promo bin appear in both top tens.
Graded segment value, top 10 sets, millions of dollars
Two counts in this study are called the same thing and are not. "Cards priced" in the cost table is products carrying a recorded market price, 237 for Evolving Skies. "Cards with a sale-backed graded price" here is registries carrying a PSA sale price at the five-sale bar, 94 for the same set. A checklist of 237 cards where 94 of them have enough recorded PSA sales to price a slab is the normal shape, and the two numbers should never be read as a contradiction.
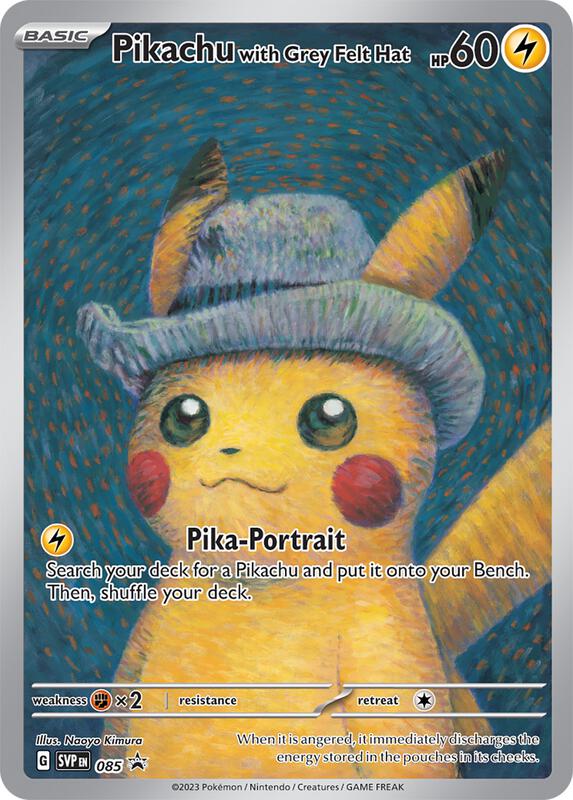
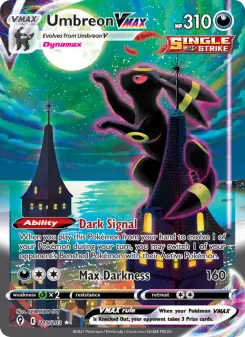
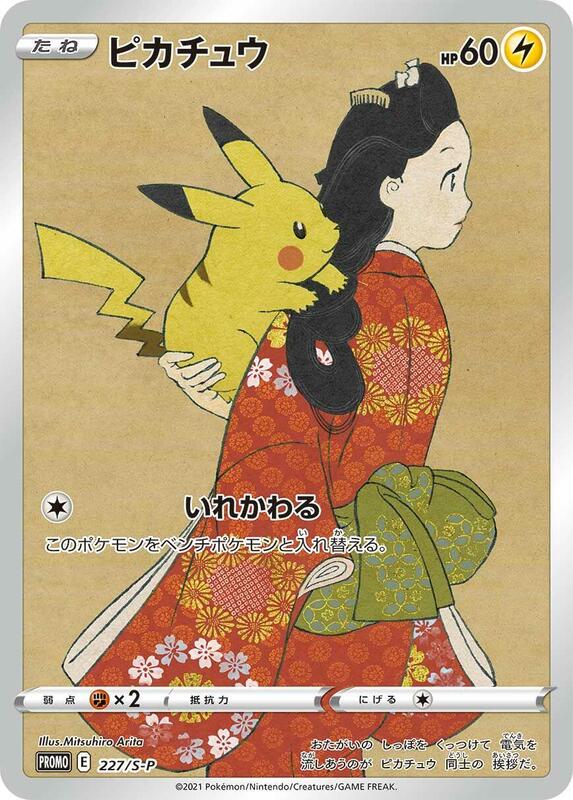
One card carries a large share of each of these. Pikachu with Grey Felt Hat is $197.7M of the $287.5M in the SVP promo bin, from 50,209 PSA 10s at $2,850 on 261 recorded sales and 55,733 PSA 9s at $979.99 on 239. Umbreon VMAX is $106.9M of Evolving Skies, which is 42.5% of the set. Worth noting against our own earlier measurement: the same card is 27.5% of Evolving Skies by raw price on this same day. The chase card takes a larger share of the graded money than it takes of the checklist, which is what it means for a card to be the one people grade.
The four cards carrying the most graded money
The two lists disagree, and the disagreement is the point
Across the 405 sets that carry both measures, Spearman rank correlation is 0.596. Three of the top ten overlap, six of the top twenty five, eighteen of the top fifty. A further 230 sets appear in the cost ranking with no measurable graded value at all, which is an absence and not a zero: 100 of them carry PSA registry readings with no grade we could price, and 130 carry no PSA registry reading at all. Neither means the slabs are worthless.
Twelve sets where the two measures disagree. Cost rank is of 635, graded rank is of 405, and the last column is computed before the dollar columns are rounded
| Set | Cost rank | Graded rank | Set cost | Graded segment | Graded dollars per $1 of cost |
|---|---|---|---|---|---|
| Celebrations Classic Collection | 294 | 24 | $476 | $59.2M | $124,378 |
| 151 | 121 | 5 | $1,782 | $164.8M | $92,463 |
| Phantasmal Flames | 176 | 14 | $1,116 | $101.4M | $90,852 |
| Terastal Fest ex (Japanese) | 151 | 12 | $1,313 | $109.4M | $83,365 |
| Obsidian Flames | 307 | 54 | $443 | $28.4M | $64,056 |
| Silver Tempest | 194 | 28 | $964 | $51.5M | $53,423 |
| Evolutions | 221 | 36 | $794 | $39.8M | $50,127 |
| Boundaries Crossed | 59 | 271 | $3,372 | $0.85M | $251 |
| Dark Explorers | 38 | 259 | $4,090 | $1.04M | $255 |
| BW Black Star Promos (promo bin) | 23 | 234 | $5,588 | $1.60M | $286 |
| Pokemon VS (Japanese) | 8 | 183 | $9,456 | $3.91M | $413 |
| Plasma Freeze | 33 | 223 | $4,718 | $1.99M | $421 |
Those twelve are a selection, not the twelve extremes, so here are the extremes. Celebrations Classic Collection has the highest ratio of all 405 sets at $124,378 of graded money for every dollar of checklist, costing $476 to finish against $59.2M in slabs. Among sets costing $2,000 or more to complete, the lowest ratio is McDonald's Pokemon-e Minimum Pack at $72, then Best of Game at $125, then Boundaries Crossed at $251. The top half of the table is one pattern: a short modern checklist, cheap to complete because most of it is common cards, holding heavy graded weight because two or three of its cards were opened in volume and graded in volume. The same shape shows up in the $100-card counts in Hundred Dollar Cards by Set.
The bottom half is mostly the Black and White era. Plasma Freeze costs $4,718 to complete, ranking 33rd, and holds $1.99M in slabs, ranking 223rd. Dark Explorers and Boundaries Crossed sit beside it. Those sets are expensive per card and very few of their copies are graded, which for an owner means a completed set that is hard to exit one card at a time.
Where the graded number is a floor, not a measurement
A graded price needs recorded sales. Modern cards sell often enough that nearly every PSA 10 copy in a modern set carries a price. Vintage cards do not, so a large part of the vintage PSA 10 population has no sale-backed price at our five-sale bar and contributes nothing. That is the right treatment, because inventing a price is worse, but it means the graded ranking systematically understates old sets and the reader has to know by how much.
Share of a set's PSA 10 copies that carry a sale-backed price at five sales or more
The promo bins are not sets, and one release is two sets
Thirty three of the 635 ranked sets are promo bins: SVP Black Star Promos, SM-P, XY-P and the rest. They are not releases, they are headings that collect a decade of scattered cards, and very few people set out to complete one. They hold 16.4% of the ranked set cost and 25.1% of the ranked graded value, they take two of the ten places in the cost ranking and six of the ten in the graded ranking. They are kept in every ranking here and marked, rather than deleted, because a selection that removes exactly the rows that look awkward is how a ranking lies. But a reader comparing a promo bin to Evolving Skies is comparing a decade to a set.
The second rule is newer and it came out of building this study. A set name in our catalog is not always a release. The Terastal Fest ex cards are filed under two different catalog set names, one written in Japanese and one written as SV8a, and this ranking counts them as two sets: 229 priced cards holding $109.4M of graded value, and 254 priced cards holding $3.5M. One release, two rows, two ranks. That is the set-level version of a fault this codebase already knows at card level, where 1,215 TCGplayer product ids are claimed by two catalog rows each. It is stated rather than patched, because collapsing two set names on a judgement about which releases are really the same one would put an opinion inside a ranking.
With the promo bins set aside, the graded top ten is Evolving Skies $251.8M, 151 $164.8M, Crown Zenith Galarian Gallery $111.0M, Team Up $110.8M, Paldean Fates $109.8M, Terastal Fest ex $109.4M, Prismatic Evolutions $106.7M, Phantasmal Flames $101.4M, Ascended Heroes $99.7M and High Class Pack MEGA Dream ex $94.1M. The cost ranking without promo bins is Skyridge, Aquapolis, Team Up, Unseen Forces, Neo Destiny, Expedition Base Set, Pokemon VS, Evolving Skies, Team Rocket Returns and Delta Species, which edges Call of Legends by $101. The two measures are not ranking the same hobby: one of those ten lists is almost entirely sets a reader would call modern and the other is almost entirely sets a reader would call old, and only Team Up and Evolving Skies are in both.
What an owner does with this
Use graded segment value as a depth reading, not a quality reading. A set with a lot of money in slabs has active sale prices, tight spreads and a place to sell one card at a time. A set with little of it may be perfectly good and simply untraded in slab form, and the vintage chart above shows why an absence there is often about sale frequency rather than value. That is the same distinction our concentration study found at card level, where 2.14% of the cards we price hold half of all of it.
Use set cost for the opposite purpose. A high cost to complete with a low graded figure, the Black and White pattern, says the checklist is expensive and the exit is thin. A low cost with a high graded figure, the 151 and Celebrations pattern, says the value has concentrated into a handful of cards and buying the checklist is not how you get exposure to it. In both cases the useful move is to stop thinking about sets and price the specific card, which is what Chase Share in 129 Sets and the set-level study both land on from different directions.
And do not repeat either number as a market cap. $892,584 is what one of everything costs today. $5.91 billion is what the recorded PSA 10 and PSA 9 copies are worth at their own recent sale prices, on one set of choices about a comp bar and a collision rule that between them move the answer by about a fifth. Neither one counts a single raw card sitting in a binder, a single sealed box, or a single copy graded 1 through 8, and there is no honest way from what we hold to a figure that does.
TABLES AND DAY. price_history day 20725, which is September 29, 2026, a complete day carrying 52,433 priced products. 52,864 distinct products appear somewhere in the 31-day file and 318 that carried a price on September 7 carry none on this day, so this is the day's record and not a census of everything we have ever priced. price is the TCGplayer market price for the standard printing where the printing rule resolves one and the daily dump's own market figure where it cannot, derived from recent sales rather than live listings. population_snapshots for grade counts and graded_snapshots for grade prices, both read as the latest recorded row per registry and per grade rather than one day, because one day is not the record: the day-20725 refresh carries only 17,201 of the 24,394 registries and 14,670,769 copies, while reading the latest row per registry gives 24,394 registries and 27,132,182 copies. 7,193 registries carrying 12,461,413 copies have no reading on that day at all. The population cron keeps polling through the day, so a later recompute reads a handful more registries and a few more copies than these counts; two independent recomputes have read 17,205 registries and 27,132,186 copies against them without moving any dollar figure in this study. Population readings span days 20667 to 20725; 1,578 of 24,394 registries were last read before day 20711. The graded sale rows span days 20655 to 20725 and most of them are older than the last day, so every graded dollar here is the latest recorded reading per registry and grade rather than a September 29 reading. Any recompute has to pin both tables at day 20725 or the daily graded rotation will move the answer. cards, collapsed to one row per TCGplayer product id, supplies the set attribution. || DEDUPE, TWICE, AND BOTH RULES ARE THE SHIPPED ONES. 2,430 catalogue rows share a TCGplayer product id with another row: 1,215 ids are each claimed by exactly two rows and none by three or more, across 51,719 rows carrying 50,504 distinct ids. So the catalogue is grouped by product id and the surviving row is chosen by pickCatalogRow in server/indices.ts: the row whose set name matches the price file's own spelling, then the lower card id. That tie-break is load-bearing rather than cosmetic. Choosing the lower card id alone returns 639 ranked sets instead of 635 and files two Japanese releases under names written in Japanese. Separately, registries were collapsed where more than one product id is FLAGGED AS POSSIBLY SERVING one PSA registry line, using sharedRegistryKeys in server/db/population.ts unchanged: both populations 500 or more, gem rates within 0.02% and totals within 2%, compared across every reading rather than the latest. That is a tolerance band and not an observed identity, and the module that owns the rule says so: it can report that more than one key claims a line, never which card owns it. That flags 992 of 24,394 registries in 454 clusters. One key per cluster is kept and 538 are dropped, and the key kept is the one carrying a catalogue row, because it is the one that can be named and pictured; then the larger population; then the lower id. The evidence behind those 538 removals splits three ways, and it is published because it is not uniform: 39 of them read an identical grade count and total to the key they were dropped for on every day both were read, worth $16.8M; 320 diverge on at least one day both were read, worth $269.9M; and 179 were never read on the same day at all, worth $56.9M. Those three add to the $343.6M the collapse removes. || THE COLLISION RULE MOVES THE ANSWER AND THE SIZE IS PUBLISHED WITH IT. Keeping one registry per line gives $5,912,596,419. Applying no collapse at all gives $6,256,191,226, which double counts every shared line. Withholding every flagged registry entirely, which is what a per-card page does because it cannot say which card owns the line, gives $5,224,697,682. This study publishes the middle one, because for an aggregate the copies are real and counting them once is right, and a reader should know the other two. That band is published for the total only. Every per-set graded figure, and every rank and ratio built on one, is the single kept-key attribution with no band around it. The largest exposure among the sets named on this page is Celebrations Classic Collection, whose $59.2M reads $64.0M if every dropped key that did not read identically to the key it was dropped for is added back, which would take its graded-per-dollar ratio from $124,378 to about $134,000. || PRICES AND SAMPLE. A grade is priced by the first figure whose comp count is five recorded sales or more: the trailing-window median first, then the all-window median, then the provider's own weighted aggregate, which is gated on the all-window comp count rather than on one of its own. The trailing window is not one width. It opens at 90 days and widens to 180 and then 365 until it holds three dated sales, and the width used is recorded per card and per grade, so a vintage figure can rest on a year of sales where a modern one rests on a quarter: Pikachu with Grey Felt Hat is priced on a 90-day window holding 261 sales and Base Set Charizard on a 365-day window holding 11. Single last sales are not used, because one sale is not a sample. This precedence is stricter than the one a card page shows, which also accepts a single last sale, so a thin card's price here can differ from its own page. Inside the universe the total is computed over, 14,087 registry-and-grade rows, of which 13,914 sit on a non-zero population and can contribute anything: 6,543 priced on the trailing window, 2,691 on the all-window median, 2,328 on the provider aggregate and 2,525 could not be priced at all. Three registries price their PSA 9 above their own PSA 10 and $13,543,233 of the total, 0.23%, sits on them. The largest is Charizard in the Japanese Expansion Pack, whose PSA 10 reads $705 on six sales against a PSA 9 at $2,999.50 on ten, and which is 73% of that set's $18.5M. They are counted and named rather than repaired, because repairing them would move the headline figure this study has already been recomputed against, and they are the same class of fault as the units trap above seen from the other side. The bar moves the answer, so it is published with it: on this same rule the graded total is $6,139,853,102 at a three-sale bar, $5,912,596,419 at five and $5,438,188,184 at ten, an 11.9% spread, with 8,671, 7,257 and 5,267 registries priced. || TWO KEYSPACES, READ TOGETHER. graded_snapshots is keyed by TCGplayer product id on most rows and by catalogue card id on some, while population_snapshots is product-id shaped throughout. 929 graded rows carry a catalogue-id key; each is folded onto its product id through cards and the FRESHER row of the two is used, which is the house rule. Eight of those cards have no product-keyed graded row at all and would have been missing entirely from a product-id-only read. || COVERAGE AND ABSENCE. 11,679,101 of 12,714,779 recorded PSA 10 copies carry a price (91.9%) and 6,623,352 of 7,726,032 PSA 9 copies do (85.7%). 5,317,400 copies graded 1 through 8 have no per-grade population and are never multiplied by anything, and 172,388 of those sit on 2,878 registries carrying no PSA 9 reading at all, so their grade is unknown between 1 and 9 rather than known to be 1 through 8, which makes the PSA 9 pool and its 85.7% priced share floors. The two pools we price are 20.4 million copies of 25.8 million recorded, and 18.3 million of those carry a price. The 27,132,182 copies counted above become 25.8 million here because the shared-line collapse removes 538 registries and the copies on them. An unpriced population is counted as unknown, never as zero, and never ranks a set last. || EXCLUSIONS. 8,041 priced products (15.3%) carry no catalogue row and are left out of every set ranking: they hold $158,001.54 of set cost, 17.7% of the whole, and $100.9M of graded value. The ranked universe is therefore 635 sets and $732,835.70 of set cost, 82.1% of the daily total, and 405 sets and $5,811,652,652 of graded value. Those two shares leave 0.2% unaccounted for, which is the two September releases excluded below. A second gap runs the other way: 46 registries that contribute graded value carry no price_history row on day 20725 at all, holding $239,451,747 or 4.05% of the graded total, so the graded figure is not literally the same product rows as the cost figure. On exactly the same product rows the graded total is $5,673,144,672. The largest of the 46 is Pikachu 227/S-P, which holds $90.2M of graded value and has no recorded market price on any day we hold. 30th Celebration and 30th Classic Collection both released on September 16, 2026, inside the price window, so both are excluded from both rankings; their preorder-priced set costs were $714.45 and $1,031.85. The second of those two resolves its release date only through the price file's own set spelling, because the catalogue calls it "30th Classic Collection" where the release table calls it "ME: 30th Celebration Classic Collection", and a release check on the catalogue name alone misses it. || FIGURES NOT USED. price_min, the cheapest-printing column, sums 4.18% higher than price across the same day ($929,891.02 against $892,583.54), and that is not a contradiction once the two columns are read as what they are. price is the canonical printing resolved from per-printing data, falling back to the daily dump's own market figure where the rule cannot resolve one; price_min is the dump's own cheapest-printing figure. They come from different sources, so neither bounds the other: on this day price_min sits above price on 6,208 products by $44,274 in total and below it on 4,221 by $6,967. The single largest gap is this page's own hero card, Charizard in Skyridge, recorded at $249.95 on price against $2,999.99 on price_min, which is why Skyridge costs $19,513.60 to complete on the column this study uses and $21,305.20 on the other one. No figure here comes from price_min.