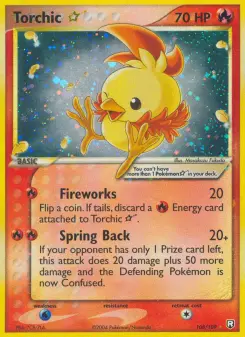
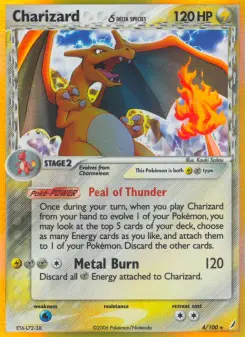
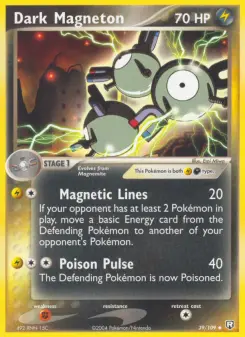
A gem rate is the share of PSA submissions on a card that come back a 10. Across the 519 English cards from the sixteen EX-era sets carrying 100 or more recorded submissions, 378,293 submissions returning 27,929 tens, the median card gems 9.4% of the time as of September 23, 2026. The figure that matters more is what the rate does as the card gets more expensive, and it goes the wrong way for a collector: the era's 25 Gold Stars gem at a median of 3.8%, its ex cards at 6.0%, its Delta Species cards at 8.8% and its ordinary cards at 12.6%, while the median ask across those same cards falls from $1,333.56 to $28.31. This is a study of the gem RATE, the share of submissions that come back tens. The PSA 10 price premium is a different quantity and is measured separately in The PSA 10 Premium, Ranked Across 90 Sets.
Why the bar is 100 submissions
All 1,694 EX-era cards carry a PSA registry row. 1,688 of them pass the trustworthiness test that our own reader applies, which rejects a recorded zero that the rest of the row contradicts; the six failures are named in the methodology and one of them, a Lugia with 721 submissions and no recorded tens at all, is the shape that test exists to catch. But a gem rate over all 1,688 is not a useful number. The median comes out at 25.4%, and it is high because hundreds of these cards carry a handful of submissions each, where one ten in three is a 33% gem rate. Raising the bar changes the answer in an orderly way, which is itself worth publishing rather than hiding behind one chosen threshold.
The same population at four submission bars
| Minimum submissions | Cards | Median gem rate | Pooled gem rate | Submissions | PSA 10s |
|---|---|---|---|---|---|
| None | 1,688 | 25.4% | 9.2% | 408,278 | 37,479 |
| 50 or more | 632 | 10.9% | 7.8% | 386,225 | 30,260 |
| 100 or more | 519 | 9.4% | 7.4% | 378,293 | 27,929 |
| 200 or more | 429 | 8.2% | 7.0% | 364,578 | 25,474 |
Every figure in this piece uses the 100-submission bar, the third row, unless it says otherwise. Note what the bar costs and what it buys: it removes 1,169 of the 1,688 cards and 7.3% of the submissions, because the cards it removes are the ones almost nobody graded. The pooled rate, tens divided by submissions rather than the median of per-card rates, barely moves across the whole table, which is the reassurance that the bar is not selecting a different market. Our earlier whole-catalogue study The Gem Rate Curve reported an EX-era median of 9.8% over 828 cards on a 50-submission bar and a wider reading of the era that takes in the POP decks, the trainer kits and the promos of the same years. Over the sixteen expansions alone this study reads 10.9% at that bar and 9.4% at the 100-submission bar used throughout, so the two are close, but they are not the same population and neither number means anything without its bar beside it.
The rate falls as the card gets dearer
Gem rate by name tier, EX era, cards with 100 or more submissions
| Tier | Cards in cohort | Median gem rate | Pooled | Submissions | Median ask in cohort |
|---|---|---|---|---|---|
| Gold Star | 25 | 3.8% | 4.1% | 61,768 | $1,333.56 |
| ex δ | 11 | 4.3% | 3.8% | 9,974 | $201.65 |
| ex | 127 | 6.0% | 6.2% | 149,459 | $180.88 |
| δ, not an ex | 63 | 8.8% | 7.0% | 50,069 | $72.12 |
| Everything else | 293 | 12.6% | 11.4% | 107,023 | $28.31 |
The five tiers hold all 519 cards. The median gem rate rises monotonically down the table, the median ask falls monotonically with it, and the pooled rate rises down the table too, with one exception, ex δ at 3.8% on eleven cards. The tier rule is a rule over the printed card name, published here so it can be reproduced: a name carrying ☆ or ★, or ending in the word Star, is a Gold Star; a name carrying ex as its own word is an ex, and an ex also carrying δ is an ex δ; a name carrying δ alone is a Delta Species card; everything else is ordinary. A glyph-only match misses five cards, because the catalogue spells Pikachu Star, Mewtwo Star, Groudon Star, Kyogre Star and Metagross Star with the word rather than the symbol, and all five carry gem rates between 3.87% and 5.31%, which is squarely in the Gold Star band they belong to.
The catalogue's own rarity column produces a weaker version of the same gradient, because it collapses every chase card in this era into "Rare": commons gem at a median 25.7% across 45 cards, uncommons at 18.2% across 23, Rares at 7.9% across 384 and Holo Rares at 10.0% across 67. That is why the name tier exists. The Charizard δ that gems 1.35% of the time and the Dark Magneton that gems 39.5% of the time are both catalogued as Rare.
The sixteen sets, hardest first
Median gem rate by EX-era set, cards with 100 or more submissions
| Set | Cards in cohort | Median gem rate | Submissions | PSA 10s |
|---|---|---|---|---|
| [Dragon Frontiers](/research/set-screen/dragon%20frontiers) | 24 | 4.3% | 27,892 | 974 |
| [Ruby & Sapphire](/research/set-screen/ruby%20%26%20sapphire) | 25 | 4.7% | 24,272 | 984 |
| [Emerald](/research/set-screen/emerald) | 31 | 6.7% | 12,993 | 928 |
| [Unseen Forces](/research/set-screen/unseen%20forces) | 38 | 6.8% | 32,905 | 2,212 |
| [Legend Maker](/research/set-screen/legend%20maker) | 26 | 7.3% | 18,135 | 1,173 |
| [Deoxys](/research/set-screen/deoxys) | 31 | 8.3% | 16,653 | 937 |
| [Team Magma vs Team Aqua](/research/set-screen/team%20magma%20vs%20team%20aqua) | 25 | 8.7% | 14,361 | 1,087 |
| [Team Rocket Returns](/research/set-screen/team%20rocket%20returns) | 43 | 8.8% | 26,502 | 2,362 |
| [Holon Phantoms](/research/set-screen/holon%20phantoms) | 40 | 9.4% | 26,826 | 1,794 |
| [Sandstorm](/research/set-screen/sandstorm) | 31 | 9.7% | 20,313 | 1,607 |
| [Crystal Guardians](/research/set-screen/crystal%20guardians) | 33 | 10.1% | 27,537 | 1,691 |
| [Delta Species](/research/set-screen/delta%20species) | 37 | 10.8% | 29,701 | 2,543 |
| [Dragon](/research/set-screen/dragon) | 30 | 11.1% | 29,190 | 2,134 |
| [Hidden Legends](/research/set-screen/hidden%20legends) | 26 | 13.0% | 15,180 | 1,958 |
| Power Keepers | 32 | 13.5% | 25,294 | 1,856 |
| [FireRed & LeafGreen](/research/set-screen/firered%20%26%20leafgreen) | 47 | 15.1% | 30,539 | 3,689 |
All sixteen sets are printed, ranked hardest to easiest, with no gaps. The spread is a factor of 3.5 from [Dragon Frontiers](/research/set-screen/dragon%20frontiers) at 4.3% to [FireRed & LeafGreen](/research/set-screen/firered%20%26%20leafgreen) at 15.1%, and part of it is composition rather than manufacturing: Dragon Frontiers is 24 cards of which 11 are ex or Gold Star, while FireRed & LeafGreen's cohort is 47 cards heavy with the basic-Pokémon commons that gem easily. This table cannot separate the press from the checklist, and neither can any set-level figure. The per-card figures below can.
The fifteen hardest cards in the era
Lowest gem rates in the EX era, 100 or more recorded submissions
| # | Card | Set | PSA 10s / submissions | Gem rate | Ask | PSA 9 sold median |
|---|---|---|---|---|---|---|
| 1 | Torchic ☆ | Team Rocket Returns | 19 / 1,467 | 1.30% | $4,500.00 | $14,800 (10) |
| 2 | Charizard δ | Crystal Guardians | 81 / 6,014 | 1.35% | $809.33 | $2,113 (60) |
| 3 | Latias ☆ | Deoxys | 22 / 1,443 | 1.52% | $1,650.00 | $910 (11) |
| 4 | Gyarados ☆ δ | Holon Phantoms | 37 / 2,282 | 1.62% | $1,333.56 | $25,394 (11) |
| 5 | Typhlosion δ | Dragon Frontiers | 24 / 1,413 | 1.70% | $91.66 | $444 (34) |
| 6 | Mewtwo ex | Ruby & Sapphire | 75 / 4,176 | 1.80% | $404.61 | $3,074 (35) |
| 7 | Azumarill | Delta Species | 6 / 323 | 1.86% | $104.95 | $404 (9) |
| 8 | Charizard ☆ δ | Dragon Frontiers | 98 / 5,241 | 1.87% | no ask | not recorded |
| 9 | Mew ☆ δ | Dragon Frontiers | 73 / 3,774 | 1.93% | $3,500.00 | $27,000 (45) |
| 10 | Latios ☆ | Deoxys | 28 / 1,370 | 2.04% | $1,500.00 | $14,848 (4) |
| 11 | Tyranitar ex δ | Dragon Frontiers | 20 / 959 | 2.09% | $201.65 | $1,222 (18) |
| 12 | Dragonite ex δ | Dragon Frontiers | 30 / 1,370 | 2.19% | $471.92 | $2,600 (21) |
| 13 | Sceptile | Ruby & Sapphire | 20 / 911 | 2.20% | $81.82 | $352 (15) |
| 14 | Hitmonchan ex | Ruby & Sapphire | 43 / 1,878 | 2.29% | $100.06 | $623 (35) |
| 15 | Rayquaza ☆ | Deoxys | 47 / 1,934 | 2.43% | no ask | not recorded |
Ranks 1 to 15 are contiguous. Eleven of the fifteen carry either the Gold Star treatment or the δ symbol, and both of those print a foil across the whole face of the card where an ordinary holo confines it to a window. The other four carry neither mark. Two of them, Mewtwo ex and Hitmonchan ex, are ex cards, which the era also printed with a foil across the face. The remaining two are neither: an Azumarill catalogued Rare and a Sceptile catalogued Holo Rare, so the full-face foil is not the whole explanation. And two of the fifteen carry no reading on the September 23 tape. Charizard ☆ δ has 5,241 recorded submissions and 98 tens, and our tape last read it at $1,000 on September 19.
Which grade the market actually trades
A gem rate is only interesting because it decides what exists to buy. Sorting the 519 cards into gem-rate bands and asking what share of each band has ever recorded a sale at each grade gives the answer directly.
Recorded sold medians by gem-rate band, 519 EX-era cards
| Gem rate | Cards | Share with a PSA 10 sold median | Share with a PSA 9 one | Median ask | Median PSA 10 | Median PSA 9 |
|---|---|---|---|---|---|---|
| Under 2% | 9 | 22.2% | 88.9% | $1,333.56 | $21,348 | $3,074 |
| 2% to 5% | 98 | 44.9% | 88.8% | $199.99 | $8,850 | $1,113 |
| 5% to 10% | 178 | 59.0% | 88.8% | $82.38 | $3,398 | $363 |
| 10% to 20% | 175 | 69.1% | 93.7% | $31.52 | $1,218 | $126 |
| 20% and over | 59 | 50.8% | 69.5% | $10.68 | $405 | $58 |
The five bands hold all 519 cards. On the nine hardest cards in the era, only two carry a PSA 10 sold median while eight carry a PSA 9 one, and a median needs three verified sales: the grade a buyer is chasing barely trades, and the grade beneath it does. That gap narrows steadily as gemming gets easier, from 22.2% against 88.9% to 69.1% against 93.7%. The last row breaks the pattern in both columns and the reason is price rather than grading: the easiest-to-gem cards are also the cheapest, and a $10.68 card is one nobody bothers to grade or to sell graded, so its record is thin at every grade. The same shape across the whole catalogue is in Hard to Gem and Easy Grades Are Cheap Grades, and the grade-by-grade version is Above $1,000, the PSA 9 Is the Grade That Trades.
The cardboard printed just before the EX run gems three times as often
The three e-Card sets, Expedition Base Set, Aquapolis and Skyridge, carry recorded release dates of September 15, 2002, January 15, 2003 and May 12, 2003. The first EX set, EX Ruby & Sapphire, followed on June 18, 2003, five weeks after Skyridge. Over the same 100-submission bar the three hold 331 cards, 163,606 submissions and 26,894 tens, and their median card gems 30.9% of the time against the EX era's 9.4%. Skyridge alone reads 37.1%. That is a factor of three across a boundary five weeks wide at its narrowest, and it is the opposite of the intuition that older cardboard is harder.
The e-Card era against the EX era, same submission bar
| Set or era | Cards in cohort | Median gem rate | Pooled | Submissions | PSA 10s |
|---|---|---|---|---|---|
| Skyridge | 126 | 37.1% | 22.5% | 52,853 | 11,897 |
| Expedition Base Set | 117 | 29.1% | 14.1% | 67,418 | 9,508 |
| Aquapolis | 88 | 27.3% | 12.7% | 43,335 | 5,489 |
| All three e-Card sets | 331 | 30.9% | 16.4% | 163,606 | 26,894 |
| All sixteen EX-era sets | 519 | 9.4% | 7.4% | 378,293 | 27,929 |
We cannot attribute that gap and we will not pretend to. Two mechanisms are consistent with it and this data separates neither. The e-Card sets sold badly, so a much larger share of their surviving population sat unopened or unplayed, which selects the submitted copies upward. And the EX-era print runs introduced the full-art foil face that the Gold Star and δ cards carry, which shows surface wear that a 2002 holo window hides. What the table does establish is that the gap is not a rarity effect: the e-Card cohort is 331 cards against 519, at similar submission depths, and it wins at the median, at the pooled rate and set by set. The Gem Rate Curve places both eras inside the whole-catalogue picture, where the hardest decade is Diamond and Pearl rather than either of these; the price census for that era is Diamond and Pearl Era Card Prices, and for the modern end of the same question, Sun and Moon Era Card Prices.
What would overturn this
The central claim is the inverse gradient: dearer EX-era cards gem less often. Three observations would break it. First, a submission-date split. A registry total is cumulative over twenty years, so if the expensive tiers were graded mostly in 2005 to 2010 under a stricter standard and the cheap tiers mostly since 2021, the gradient is a calendar effect and not a card property. Our study Where the New Slabs Go shows the standard does move with the inflow, so this is a live objection rather than a rhetorical one, and this study cannot answer it: our population snapshots begin in 2026 and hold no submission dates. Second, a raw-price control. The gradient could be price standing in for era or for foil treatment; the tier table holds era fixed by construction, but not the foil, and the δ tier is the row that would separate them if the sample were larger than 63 cards. Third, a provider mismap. If several products share one PSA registry line, a per-card rate is not a per-card rate; we tested for it and no two cards in the 519 carry an identical submission triple, which is the signature a shared line leaves. Across the full 2,227-product ground 187 groups of two or more products do carry an identical triple, 460 products in all, and exactly one of those groups sits above 98 recorded submissions: Mr. Mime 95a and 95b in Aquapolis at 119. Below a hundred submissions a coincidence and a shared line cannot be told apart. None of the 187 groups reaches inside the cohort this study reports on.
What this study cannot show
A registry is not a print run. It counts the copies somebody chose to pay to grade, and on a 20-year-old card that choice is made on the copy's appearance, so every rate here is conditional on a submission having been worth making. The direction of that bias is not constant across tiers: an owner will submit a battered Gold Star because the downside is small relative to the card, and will not submit a battered common at all, which by itself would push the cheap tiers up and the expensive tiers down, exactly the gradient being reported. This study cannot remove that and it is the strongest reason to treat the tier table as a description of the registry rather than of the cardboard. A missing PSA 10 row is "not recorded", never zero, and six EX-era rows were dropped for failing that test rather than being pooled as zeroes. Per-set submission totals are sums over registry lines and would double count any line shared by two products; none is shared inside the cohort, but the column should still be read as registry lines rather than as a slab count. All prices are asks on one day and all graded medians are sold prices over verified sales, printed with their samples. Nothing here is a forecast and nothing here is investment advice.
Population: the 1,694 English cards in the sixteen EX-era sets and the 533 in the three e-Card sets, from `cards` with `lang = 'en'`, deduplicated on `tcg_id`, which collapsed zero rows in this ground and 1,212 across the catalogue. PSA registry counts come from `population_snapshots`, taking `MAX(day)` per `card_key` and reading BOTH the catalogue-id and the TCGplayer-id keyspaces with the fresher row kept; the latest day differs per card and spans day 20704 to day 20719, which is 2026-09-08 to 2026-09-23, and 2,196 of the 2,227 sit on day 20717 or later. Gem rate is recorded PSA 10s divided by recorded total submissions. Every row passes `gemRateIsTrustworthy()` from `@cardapp/core/server`, called with the card's recorded PSA 10 sold count, which rejects a recorded zero that the rest of the row contradicts. Six EX-era rows fail it and are excluded rather than counted as 0%: Lugia 29 in Unseen Forces (721 submissions, no recorded tens, and 16 verified PSA 10 sales that overrule the row), Lightning Energy 109 in Ruby & Sapphire, Team Magma Technical Machine 01 84 in Team Magma vs Team Aqua, and Glalie 30, Metang 35 and Energy Removal 2 74 in Power Keepers. No e-Card row fails it. The cohort is then the 519 EX-era and 331 e-Card cards with 100 or more recorded submissions; the 50-, 100- and 200-submission alternatives are printed in full in the second table so the bar's effect is visible rather than assumed. Median means the upper middle value on even samples, applied to every median in the piece. Pooled means the sum of tens over the sum of submissions, which is a sum of registry lines and is labelled as such. The name tier is a rule over `cards.name`: `[☆★]` anywhere or a trailing word `Star` is a Gold Star (25 cards in the era, 20 by glyph and 5 by word, all five named in the article); standalone `ex` with `δ` is ex δ; standalone `ex` alone is ex; `δ` alone is Delta Species; the rest are ordinary. The tiers partition the population exactly. Asks are `price_history.price` on day 20719, 2026-09-23, the fullest of the tape's 25 days at 52,378 rows; two cards in the hardest-fifteen table carry no row on that day and are printed as "no ask" rather than dropped. PSA 9 and PSA 10 sold medians come from `graded_snapshots`, latest row per card and grade across both keyspaces with the fresher row taken, printed with their verified-sale counts; the cron writes a median only on three or more sales, so "not recorded" means fewer than three. A graded row is dropped when the fresher of the two keyspaces still predates the tape's first day, 20695. Across the 2,227 products that removes seven PSA 9 and PSA 10 medians on five cards, all seven in the catalogue-id keyspace: both grades of Rocket's Scizor ex 101 at day 20655 and of Rocket's Mewtwo ex 99 at day 20661, the PSA 10 of Metagross Star 113 at day 20655, and the PSA 9 medians of Gyarados H10 in Skyridge and Tyranitar H28 in Aquapolis at day 20675. Three of the seven are PSA 10 medians and none of the seven is printed in this study. The shared-registry-line test groups all 2,227 products on the (PSA 10, PSA 9, total) triple, counting a pair of null PSA 9 fields as a match, which is the lenient reading: 187 groups of two or more products, 460 products. Requiring a recorded PSA 9 on both sides instead gives 186 groups and 456 products, and neither reading changes the shape, because only one group in either sits above 98 submissions, Mr. Mime 95a and 95b in Aquapolis at 119. No group reaches inside the 519. Scripts: apps/web/scripts/vex-build.mts, vex-gem.mts and vex-figures.mts; every printed figure with its query is in apps/web/.scratch-vintage-ex/figures.json. Nothing here is investment advice.