Three facts belong in front of every number below. The population is the 35 English sets our pack model can simulate, 16 from Scarlet and Violet, 13 from Sword and Shield and 6 from Mega Evolution, which is every set in `SIMULATABLE_SETS` that returned a usable answer. Four more sets are refused outright, with reasons printed further down, and roughly 600 other sets in our catalogue are missing because we hold no pack model for them, which is a gap in our coverage and not a score of zero. Within those 35 sets, every one of them returns less than a dollar for a dollar: the cards in an average pack are worth between about 18 cents and about 57 cents per dollar the pack costs, with a middle figure of 36 cents, and that is before you try to sell anything.
That packs lose money is not news and this article is not announcing it. 260,000 Simulated Boxes established it by simulation on 26 sets, and Booster Box Expected Value Has Error Bars established it again in closed form on 27, at a median 0.380 of the box price. Four things here are new. The denominator is one loose pack, which is the unit somebody at a shop counter actually buys, and no study of ours has used it. The panel is 35 sets rather than 27, which adds the eight sets sold without a booster box, among them 151 and Prismatic Evolutions, which the prior study explicitly could not score. We can show the whole spread of outcomes, which a closed-form calculation structurally cannot produce. And the ranking of which set gives you the most for your money reorders substantially once you ask which cards a buyer will actually purchase, which is the part that would mislead somebody choosing what to open.
| Figure | What it is |
|---|---|
| $0.36 | median value of the cards in one pack, per dollar the pack costs, across all 35 sets at market prices on 30 September 2026 |
| $0.15 | the same median once you keep only cards worth $5 or more and allow a 0.85 realisation factor, across the 27 sets where we have that measurement. Best in that column is 29 cents. Nothing reaches 30 cents |
| 35 of 35 | simulatable sets returning less than $1 per $1 on a loose pack. Range roughly 18 to 57 cents |
The two questions people are actually asking
Crown Zenith holds the most valuable average pack in the study. Its contents come to $12.22 against a $25.65 loose pack, which is 48 cents back per dollar and second best of the 35. Temporal Forces holds less than half that value per pack, $5.34, and is the best value for money in the study at about 57 cents per dollar, because a loose pack costs $9.27. Somebody who wants the most cards per pack and somebody who wants the most cards per dollar should buy different sets.
Evolving Skies is where the two questions come apart hardest. It carries the dearest loose pack of all 35 at $45.80, which is 54 percent above the next dearest, and it is still third by average pack value at about $8.40. It returns the least of any set in the study, 18 cents per dollar. So the set with the richest packs at the bottom of the list is not there because its cards are poor. It is there because of what the pack costs, and the reason packs cost that is the sealed product's own scarcity rather than anything inside it.
Why the average is not what you should expect
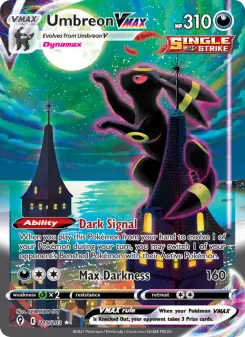
Picture sixty seven sealed boxes of Evolving Skies on a table. About one of them has an Umbreon VMAX inside, and that single card is worth $2,215. The other sixty six do not have one.
Add up everything all sixty seven boxes hold, divide by sixty seven, and you get $302 a box. That is the average, and it is a true number. It is just not a number about your box. If you buy one box you are almost certainly buying one of the sixty six, and those hold about $138 of cards.
This is what a chase card does to an average. One card that turns up in roughly one box in sixty seven carries about a ninth of the whole set's figure on its own, and the top three chase cards between them carry almost a third of it. When somebody quotes you an expected value for a set like this, most of what they are quoting is a card you will probably not pull.
Not every set behaves this way, and the difference is the most useful thing in this study. It depends on how much of a set's money sits in cards almost nobody pulls. Where a set's value is spread across many mid-priced cards, the average and the typical outcome are close together and the published figure means something to you. Where it is concentrated in one or two enormous cards, they come apart.
How far the average sits from what you are likely to get
| Set | Average per $1 | What a typical box gives back per $1 | How far apart |
|---|---|---|---|
| Evolving Skies | $0.18 | $0.08 | 2.18x |
| Prismatic Evolutions | $0.42 | $0.24 | 1.73x |
| Fusion Strike | $0.24 | $0.14 | 1.70x |
| Ascended Heroes | $0.38 | $0.25 | 1.52x |
| Paldean Fates | $0.28 | $0.19 | 1.51x |
| Crown Zenith | $0.48 | $0.44 | 1.08x |
| Obsidian Flames | $0.27 | $0.25 | 1.08x |
| Temporal Forces | $0.58 | $0.55 | 1.05x |
| Shrouded Fable | $0.36 | $0.34 | 1.04x |
Read the last column first. Where it is near 1, the figure you are quoted is roughly the figure you get: Temporal Forces, Shrouded Fable and Crown Zenith are all honest about themselves in that sense. Where it is large, the published number belongs to somebody else's lucky box. Evolving Skies is the extreme case, and it is also the set people most often buy on the strength of its average, which is exactly the trap.
None of this makes the chase card a bad reason to open packs. Wanting the Umbreon is a perfectly good reason to buy Evolving Skies. It is just worth knowing that you are buying a one in sixty seven ticket and about 8 cents on the dollar of everything else, rather than the 18 cents the average implies.
Every set, four ways
The first money column is the one every published pack and box calculation uses: cards valued at TCGplayer market prices, nothing deducted. The second takes 15 cents off the dollar for marketplace fees and postage. The third additionally throws away every card worth under $5 on the grounds that no buyer will purchase it one at a time, and it is the closest thing here to money you could actually collect. The last column is the middle outcome rather than the average, measured 36 packs at a time. Read the last two before you read the first.
All 35 sets, sorted on the unrounded return per dollar. One run of 600 simulated boxes per set, card prices as read 30 September 2026, pack prices stamped 29 or 30 September 2026. Gaps of about five cents or less are not ranked. Rows marked (floor) hold priced cards our pack model cannot place in any pack slot, so their figure is a floor rather than an estimate.
| Set | Era | Loose pack | Contents per pack | Return per $1 | After fees, x0.85 | Sellable basis | Middle outcome per $1 |
|---|---|---|---|---|---|---|---|
| Temporal Forces | SV | $9.27 | $5.34 | $0.58 | $0.49 | $0.29 | $0.55 |
| Crown Zenith | SWSH | $25.65 | $12.22 | $0.48 | $0.40 | not computed | $0.44 |
| Pitch Black | ME | $6.07 | $2.72 | $0.45 | $0.38 | $0.15 | $0.34 |
| Twilight Masquerade | SV | $9.26 | $4.08 | $0.44 | $0.37 | $0.20 | $0.38 |
| Mega Evolution | ME | $8.12 | $3.51 | $0.43 | $0.37 | $0.18 | $0.34 |
| Destined Rivals | SV | $9.12 | $3.92 | $0.43 | $0.37 | $0.20 | $0.34 |
| Perfect Order | ME | $5.75 | $2.44 | $0.42 | $0.36 | $0.13 | $0.36 |
| Scarlet & Violet | SV | $9.10 | $3.86 | $0.42 | $0.36 | $0.20 | $0.39 |
| Prismatic Evolutions | SV | $14.23 | $5.92 | $0.42 | $0.35 | not computed | $0.24 |
| Paradox Rift | SV | $8.44 | $3.51 | $0.42 | $0.35 | $0.19 | $0.38 |
| Astral Radiance | SWSH | $10.62 | $4.33 | $0.41 | $0.35 | $0.19 | $0.34 |
| Journey Together | SV | $6.83 | $2.77 | $0.41 | $0.34 | $0.13 | $0.37 |
| Chaos Rising | ME | $5.60 | $2.26 | $0.40 | $0.34 | $0.13 | $0.32 |
| Surging Sparks | SV | $8.50 | $3.35 | $0.39 | $0.33 | $0.18 | $0.31 |
| Stellar Crown | SV | $10.66 | $4.18 | $0.39 | $0.33 | $0.18 | $0.32 |
| Ascended Heroes | ME | $12.94 | $4.92 | $0.38 | $0.32 | not computed | $0.25 |
| 151 | SV | $29.80 | $10.97 | $0.37 | $0.31 | not computed | $0.32 |
| Shrouded Fable | SV | $14.45 | $5.18 | $0.36 | $0.30 | not computed | $0.34 |
| Phantasmal Flames | ME | $11.71 | $4.15 | $0.35 | $0.30 | $0.15 | $0.24 |
| Paldea Evolved | SV | $15.56 | $5.21 | $0.33 | $0.28 | $0.19 | $0.27 |
| Brilliant Stars | SWSH | $16.97 | $5.67 | $0.33 | $0.28 | $0.20 | $0.30 |
| Lost Origin | SWSH | $19.56 | $6.18 | $0.32 | $0.27 | $0.17 | $0.22 |
| Battle Styles | SWSH | $9.54 | $3.00 | $0.31 | $0.27 | $0.09 | $0.24 |
| Silver Tempest | SWSH | $15.05 | $4.71 | $0.31 | $0.27 | $0.17 | $0.22 |
| Black Bolt (floor) | SV | $14.94 | $4.60 | $0.31 | $0.26 | not computed | $0.27 |
| Sword & Shield | SWSH | $11.09 | $3.37 | $0.30 | $0.26 | $0.11 | $0.27 |
| Paldean Fates | SV | $24.94 | $7.04 | $0.28 | $0.24 | not computed | $0.19 |
| White Flare (floor) | SV | $14.25 | $3.99 | $0.28 | $0.24 | not computed | $0.25 |
| Obsidian Flames | SV | $13.03 | $3.47 | $0.27 | $0.23 | $0.11 | $0.25 |
| Chilling Reign | SWSH | $12.41 | $3.25 | $0.26 | $0.22 | $0.10 | $0.20 |
| Rebel Clash | SWSH | $12.28 | $3.06 | $0.25 | $0.21 | $0.05 | $0.23 |
| Fusion Strike | SWSH | $18.86 | $4.44 | $0.24 | $0.20 | $0.12 | $0.14 |
| Vivid Voltage (floor) | SWSH | $11.09 | $2.43 | $0.22 | $0.19 | $0.05 | $0.19 |
| Darkness Ablaze | SWSH | $9.85 | $2.14 | $0.22 | $0.18 | $0.05 | $0.20 |
| Evolving Skies | SWSH | $45.80 | $8.38 | $0.18 | $0.16 | $0.13 | $0.08 |
The sellable column is not a second measurement. It is this study's own return figure multiplied by a per-set ratio taken from Booster Box Expected Value Has Error Bars, which measured, set by set, how much of a pool's paper value survives keeping only the cards worth $5 or more and then applying the 0.85 realisation factor. That adjustment touches only the value of the cards, never the price of the pack, so the ratio carries across from a box denominator to a loose-pack denominator without modification. The $5 threshold and the 0.85 factor are stated conventions, not measurements of your own sale, and the ratio was measured on 22 September 2026 while the pack prices here were read on 30 September, an eight-day gap that is real and that we are not smoothing. The ratio is far more stable than the price level, which is why the transfer is defensible, but a reader is owed the dates. Eight sets show "not computed" because they have no booster box, so the prior study never decomposed their pools by price band. We will not lend them the panel median: Prismatic Evolutions and Paldean Fates are shiny-heavy sets whose value is concentrated quite unlike the average, and the measured ratios already range from 0.210 on Rebel Clash to 0.687 on Evolving Skies. Recomputing the price-band split on those eight pools is the one follow-up worth running.
Across the 27 sets that carry a ratio, the haircut cuts the value of a pack's contents by a median of 55 percent. That is the assumption doing most of the work in this whole study, and the prior article measured exactly that: the fee cushion moves the answer 15 percent by construction, while the decision to count or discard cards worth under $5 moves it 47.5 percent.
The ranking reorders once you ask what can be sold
This is the most useful thing in the dataset and it is easy to miss. Compare the two rankings across the 27 sets where we can compute both, remembering that these ranks are out of 27 while the main table above ranks 35. They agree only loosely, with a rank correlation of 0.74, a median move of 4 places and a maximum of 13.
| Set | Rank on paper (of 27) | Rank on what can be sold (of 27) | Share of paper value in cards worth $5 or more |
|---|---|---|---|
| Pitch Black | 2nd | 15th | 39 percent |
| Perfect Order | 6th | 16th | 37 percent |
| Journey Together | 10th | 17th | 37 percent |
| Chaos Rising | 11th | 18th | 37 percent |
| Battle Styles | 18th | 24th | 34 percent |
| Brilliant Stars | 16th | 4th | 69 percent, the highest but one |
| Paldea Evolved | 15th | 7th | 66 percent |
| Silver Tempest | 19th | 12th | 65 percent |
| Evolving Skies | 27th | 19th | 81 percent, the highest in the panel |
The cheap current-era sets look excellent on paper and ordinary once sold, because their packs are cheap and most of what falls out is cheap with them. Brilliant Stars and Paldea Evolved look ordinary on paper and are among the best once sold, because the value that is there sits in cards somebody will buy individually. So the instruction is simple: do not choose what to open from a value-per-dollar figure computed at market prices, including the one in the fifth column of our own table, because that ranking is partly measuring bulk you will never convert.
A dearer pack is not a fuller pack
Return per dollar falls as the pack price rises. Across the 35 sets the correlation against the logarithm of the pack price is -0.46. A $45.80 Evolving Skies pack returns 18 cents on paper where a $9.27 Temporal Forces pack returns about 57 cents, and the $29.80 151 pack returns 37 cents. A premium loose-pack price is buying scarcity of the sealed product, not better cards inside it. This is not a small effect and it points the opposite way to most people's intuition.
Switching to a box does not rescue it
A common assumption is that loose packs carry a per-pack premium and a box is the cheaper way in. That is true for only 16 of the 27 sets here, and where it holds the saving is small: the median box works out to 0.947 of the loose pack price per pack, about 5 percent. For 11 sets the box is the dearer way to buy the same pack, sometimes by a lot. Sword & Shield costs $19.14 a pack inside a box against $11.09 loose, Fusion Strike $26.97 against $18.86, and Evolving Skies $64.19 against $45.80. On an out-of-print set the sealed box is priced for people who collect sealed boxes, so paying up for it buys less per dollar rather than more. The Convenience Tax found the same two-sided picture on a wider 47-set panel on 5 September 2026, and it fell the other way on the majority: the loose pack was the cheaper route per pack in 29 of 47 sets there. The two panels are not the same panel, since this one also requires a pack model and one exactly named 36-pack box, and they are 24 days apart. The agreement worth keeping is that neither format is reliably the cheaper one, which is the opposite of what most buying advice assumes.
It does not change the conclusion either way. On the box basis all 27 sets still return under a dollar, at a median of 0.379 and a best of 0.621 on Temporal Forces, which is within a hair of the 0.380 median the prior closed-form study published eight days earlier on the same panel.
The average is not the usual outcome
In all 35 of the 35 sets the average outcome sits above the middle one. The middle outcome sits a median of 17 percent below the average, and 54 percent below in the widest case, which is Evolving Skies at $138.13 against an average of $301.80. Every sentence in this section is measured 36 packs at a time, because that is the unit we simulated. We never simulated a single pack's distribution, so we cannot tell you what one pack typically returns and nothing here should be read as saying so.
Switch the whole panel from the average to the middle outcome and it falls further: a median of 27 cents per dollar, a worst of 8 cents on Evolving Skies, a best of 55 cents on Temporal Forces.
Then there is the part nobody has published, and it is the one place the spread changes a decision. The set with the best average is not the set that gives you a chance of coming out ahead. Temporal Forces has the best average in the study and its luckiest 5 percent of runs still only reach about 0.95 of what the packs cost, 36 packs at a time. Ten of the 35 sets do clear their own cost at least one run in twenty, led by Phantasmal Flames at about 1.80, with Ascended Heroes at about 1.35, Lost Origin at about 1.30 and Prismatic Evolutions at about 1.20. No set clears its cost at the 75th percentile. So if the point of opening is the small chance of a big result, the sets that offer it are not the sets that rank best on average, and every one of them is still a losing proposition at the middle.
Percentile figures in this study are rounded to the nearest $5 per 36 packs, or the nearest $0.05 per dollar, and they should be. One run of 600 simulated boxes puts the 5th percentile at the 30th ordered run and the 95th at the 570th, and on the heavy-tailed sets the sampling error alone is 3 to 6 percent of the average. A 3,000-run rebuild would tighten them and would not move the averages.
Three sets in the table are floors, not estimates
Black Bolt, White Flare and Vivid Voltage contain cards our pack model places in no pack slot at all, so those cards cannot fall out of a simulated pack even though we hold a price for them and count them as covered. We verified the stored rarity of each one against the catalogue rather than inferring it from a code comment. Victini and Zekrom ex in Black Bolt, and Victini and Reshiram ex in White Flare, all carry the rarity string "Black White Rare"; Rayquaza in Vivid Voltage carries "Amazing Rare". Neither string appears in the tier mapping our simulator uses. In Black Bolt and White Flare those unreachable cards are the two most expensive cards in the set, $1,252.67 of them in Black Bolt and $1,044.04 in White Flare, and consistent with that they recorded zero hits across 21,600 simulated packs.
It matters and it does not threaten the headline, and both halves of that deserve stating with a number. For Black Bolt to reach a dollar back per dollar, its unreachable top tier would have to hit about one pack in 60. For White Flare, one in 51. The rates the model actually rolls for that era, from the Stellar Crown study, are one in 137 for hyper rares and one in 90 for special illustration rares, so the unreachable tier would have to hit more often than either of the era's own top tiers. Vivid Voltage cannot flip at any rate at all: its six unreachable Amazing Rare cards, which we counted in the catalogue, average $8.19 against a gap of $8.74, so a copy in every single pack would still fall short.
That is also why 100 percent price coverage is the wrong reassurance to take from this study. Coverage counts cards we hold a price for, and on 33 of the 35 sets it is complete, with Brilliant Stars at 215 of 217 and Phantasmal Flames at 129 of 130. Coverage says nothing about whether a card can be drawn.
Whose odds these are
Only 6 of the 35 sets carry pull rates measured on that set: 151, Prismatic Evolutions, Temporal Forces, Paldean Fates, Crown Zenith and Evolving Skies. The other 29 inherit one representative set per era, Stellar Crown for Scarlet and Violet on 8,000-plus packs, Lost Origin for Sword and Shield on 8,000-plus packs, and Mega Evolution for its own era on 5,000-plus packs. A reader can reasonably take "published pull rates" to mean somebody opened packs of this set, and for 29 of these 35 nobody did.
Published rates genuinely differ inside one era. Our own model records the special illustration rare rate moving from one pack in 32 on the Scarlet and Violet base set to one in 90 on Stellar Crown and one in 94 on Destined Rivals, which The Pull Rate Squeeze took apart and Pokemon Pull Rates by Set goes through set by set. The consequence for reading our table is firm: two sets separated by five cents or less are not ranked, and the comparison that is safe is the era-level one, where Scarlet and Violet and Mega Evolution sit at a median of 40 cents and Sword and Shield at 30 cents.
One further honesty item on the era with the weakest odds. In Sword and Shield our catalogue cannot separate some card styles that the published rates count separately: full-art and alt-art V cards share one "Ultra Rare" string, and rainbow and gold secrets share one "Secret Rare" string. Our simulator rolls each published rate over the shared pool and draws uniformly inside it, which the code's own notes state. In Evolving Skies that shared secret pool runs 34 cards deep, from a $2,214.79 Umbreon VMAX alt art and a $1,255.44 Rayquaza VMAX down to secret-rare basic energy. Two checks on whether that breaks the figure. The simulated rate for the Umbreon VMAX itself came out at 9 runs in 600, about one pack in 2,400, against the roughly one in 2,000 our model's own source gives for a named alt-art VMAX; at nine hits that is loose agreement rather than a tight one, but it is agreement, not over-crediting. And the prior study measured what the uniform-draw convention is worth: value each tier at its median card instead of its average and expected value falls by a median of 28.9 percent across 27 sets, and by 62.5 percent on Evolving Skies. Nobody has measured which direction real packs depart from uniform, so Evolving Skies' $8.40 a pack should be read to the nearest dime with that sensitivity attached, not as a point estimate.
What this number is, and what it is not
Return per $1 is the average market value of the cards in one booster pack divided by what that set's single loose pack costs, with both sides quoted at TCGplayer market prices and no deduction for selling fees, shipping, or the cards that no buyer will purchase one at a time.
Both sides of that fraction are asking prices, not proceeds. The pack price is what a shop charges you. The card prices are the same market figures every card page on this site shows, which is closer to what a buyer pays than to what a seller nets. Selling the cards costs you marketplace fees, postage and the discount you accept to move a card promptly, and a large share of the cards in any pack cannot be sold individually at all. Our earlier box study measured that second problem directly: keeping only cards worth $5 or more, and allowing a 15 percent cushion for fees and shipping, cuts the value of a box's contents by a median of 55 percent. Apply the same haircut to the pack prices here and the money you could realistically expect back lands between 5 cents and 29 cents per dollar, with a median of 15 cents, across the 27 sets where we have that measurement. The $5 threshold and the 15 percent cushion are stated conventions, not measurements of your own sale.
The dates. Card prices are the daily market figures as read on 30 September 2026. Pack and box prices carry their own sync stamps, which fall between 29 September 2026 at 03:45 UTC and 30 September 2026 at 03:47 UTC. Card prices move daily, pack prices move often, and box prices on an old set can sit unchanged for weeks. In the eight days since our box study, the Evolving Skies box moved from $2,408.12 to $2,310.75 while the Sword & Shield box did not move at all, at $688.99 on both dates. Every figure here is one reading from one marketplace in one week. The pack simulator pages on this site show current prices, so the figure they show today will drift away from this table within weeks. Where the two disagree, the live figure is the current one and this article is the dated one.
The 35 sets. We can run this only where somebody has published pull rates from a real sample and we can resolve one unambiguous single-pack price. That is 35 English sets across Scarlet and Violet, Sword and Shield, and Mega Evolution. Four more are deliberately refused: Celebrations and Shining Fates, because only low-reliability community samples exist for them, and Champion's Path and Pokemon GO, because neither contains a non-holo Rare and the era pack structure in our model does not describe their packs. A guess would be worse than silence. Every other set in the catalogue is missing because we hold no pack model for it, not because it scored badly.
Whose odds these are. Only 6 of the 35 sets carry pull rates measured on that set. The other 29 borrow their era's rates, measured on one representative set. Read one set's figure as its era's odds crossed with that set's own cards and prices, and do not read a few cents between two neighbouring sets as a real difference.
Averages and typical outcomes. The average is pulled up by rare expensive cards. In all 35 sets the average sits above the middle outcome, and the middle outcome sits a median of 17 percent below the average and 54 percent below in the widest case. Everything we can say about the spread is measured 36 packs at a time, because that is the unit we simulated. We cannot tell you what a single pack typically returns.
Three sets are understated. Black Bolt, White Flare and Vivid Voltage contain cards whose rarity our pack model does not yet place in any pack slot, so those cards cannot fall out of a simulated pack even though we hold a price for them. In Black Bolt and White Flare that includes the set's most expensive card. Treat those three figures as floors, not estimates.
Not advice. This is not a recommendation to buy any set, and the set at the top of the table is not a good trade. All 35 return less than a dollar per dollar before you sell anything, and none of the 27 we can adjust clears 30 cents after. Opening packs is entertainment with a measurable price. If what you want is the card, the honest comparison is the card's own price, which is on its page.
The one citable sentence. Across the 35 English sets moonstone can simulate, the cards in one loose booster pack were worth a median 36 cents per dollar the pack costs on 30 September 2026, with no set above about 57 cents, and a median 15 cents per dollar across the 27 sets where we can also drop the cards no buyer purchases individually and allow a stated 15 percent cushion for fees and shipping. Card values are TCGplayer market prices rather than proceeds of a sale.
What to do differently
If you want a specific card, buy the card. The best figure in this entire study is 29 cents back per dollar, and that is the best case on the best set after fees and unsellable bulk. The Rip Tax measured the other side of the same arithmetic: chasing a set's top card through packs costs between 6.3 and 85.7 times simply buying it. Charizard ex from 151 has a price. Umbreon ex from Prismatic Evolutions has a price. Mega Charizard X ex from Phantasmal Flames has a price. Packs are not a cheaper route to any of them.
Do not pick what to open from a value-per-dollar figure. That ranking moves a median of four places and up to thirteen once the cards nobody buys individually are removed, and the sets it flatters most, Pitch Black, Perfect Order and Journey Together, are precisely the ones whose paper value is cheap cards. If you are going to use a ranking, use the sellable column, and accept that eight sets do not have one yet.
Treat the pack price as a warning, not a promise. Return per dollar falls as the pack price rises. The cheap current Mega Evolution packs at $5.60 to $6.07 return around 40 to 45 cents on paper; the $45.80 Evolving Skies pack returns 18 cents. Paying more per pack has bought scarcity of the sealed product every time we have measured it.
And the framing that makes the rest of it make sense: open packs because you want to open packs. The figure in the table is the price of the entertainment, not a forecast of what you will get back. A $9.27 Temporal Forces pack is about $4 of entertainment and about $5 of cards at market prices, and roughly $2.70 of cards you could realistically sell. That is a fair thing to buy knowingly. It is a bad thing to buy expecting the cards to pay for it.
What would overturn this
A matched set of realised sale proceeds from opened packs, on these sets on these dates, that landed above the market-price value of the contents would overturn the direction of the whole study, because every assumption we test pushes the figure down rather than up. More narrowly, a published pull-rate study showing that draws inside a rare tier are materially non-uniform would invalidate the average-of-pool convention and with it every figure in the fourth column, in a direction set by which cards are short printed. And if a future revision of our pack model placed Black White Rare and Amazing Rare cards in a pack slot at a published rate, Black Bolt and White Flare would rise, though the bounds above show that reaching a dollar would need that tier to hit more often than either top tier the era's rolled study publishes.
Methodology
Universe: the 35 sets in `SIMULATABLE_SETS` in `src/server/pack-sim.ts` for which `simulateSetEv()` in `src/server/pack-ev.ts` returned `available: true` on 30 September 2026. Every one of the 35 did. Expected value per pack is the mean of 600 simulated 36-pack boxes per set, divided by 36, rolling exactly the slot plans, tier odds and card pools the site's live pack simulator uses, from `src/content/pack-model.json`, whose every numeric odds field carries a source URL and a sample size and whose null fields mean the rate was never published. A tier with no published rate is never rolled, so a set with an unpublished gallery or god-pack rate has a small unquantified slice of its contents missing from the expectation. Card prices come from `marketPriceByCardId()`, the same resolver every card page uses; an unpriced card contributes $0, which biases the result downward and is negligible here, since 33 of the 35 pools are priced in full and the other two are short by one and two cards.
Denominators: `boosterPackPrice()` in `src/server/box-price.ts`, which resolves one exact TCGplayer single-pack SKU per set, named `<set> Booster Pack`, and returns null rather than guessing. All 35 resolved, with no ambiguous or duplicate SKU, and each row's own sync stamp falls between 29 September 03:45 UTC and 30 September 03:47 UTC. Box prices, used only in the box-versus-pack section, come from the same table by the same rule at 36 packs.
Cross-check: an independent recompute solved the expectation analytically over the same slot plans and odds, rather than by simulation, with a separate parser for the pack model, on nine sets chosen to span the panel. All nine landed within two standard errors of the figures published here, five above and four below, and the whole scatter is consistent with sampling noise at 600 boxes. Reconciling this run against the closed-form study of 22 September gives a median absolute difference of 2.3 percent across all 27 overlapping sets and a maximum of 7.1 percent, with 22 of 27 inside 5 percent, across two different engines and eight days of price drift; Temporal Forces agrees to 0.1 percent. Two consequences of the 600-box count are stated rather than hidden. Averages are sound. Percentiles are not precise, so every percentile-derived figure here is rounded to the nearest $5 per 36 packs or $0.05 per dollar, and the heavy-tailed sets carry a standard error of 3 to 6 percent of the average, which is why Evolving Skies is quoted to the dime. Temporal Forces' return prints as $0.58 in the table, which is the recorded figure; the analytic recompute gives $0.57, and the two-decimal value moves between runs, so the prose says about 57 cents and the range says roughly 18 to 57 cents.
The sellable column: the per-set ratio of contents value keeping only cards worth $5 or more at 0.85 realisation, to contents value at market prices, taken directly from the published table in Booster Box Expected Value Has Error Bars, measured 22 September 2026, and multiplied into this study's return figure. The adjustment operates only on the value of the contents and is independent of the denominator, so the ratio transfers from a box basis to a loose-pack basis unchanged. Ratios run from 0.210 to 0.687 with a median of 0.446. Eight sets have no ratio because they have no booster box SKU and the prior study never decomposed their pools; they print "not computed" and are excluded from every sellable-basis statistic.
Two counting cautions. Astral Radiance's pooled-card count of 276 double counts its Trainer Gallery, which appears in our catalogue both as a 30-card subset and as 30 rarity-less rows inside the main set; no value is lost, because the subset copies are the ones that roll, but do not read that 276 as a set size, and no other Trainer Gallery set in the panel has the duplicate. And rounding: seven pairs of neighbouring rows in the table round to the same two-decimal figure, and the table is sorted on the unrounded value, so a row above another by nothing visible is not ranked above it.