On September 28, 2026, the median Illustration Rare asks $11.99 and the median Special Illustration Rare asks $34.28, across 482 and 222 English cards. So the SIR asks about 2.86x the IR, close to the 2.87x step the rarity chart measured five days earlier. Slab them and the premium runs the other way: the median IR's PSA 10 sells for 12.24x its own ask against 3.40x for the median SIR. At the three-sale bar we publish at, the IR's PSA 10 median is $152.50 and the SIR's is $115.80, though that level gap closes when you demand more sales and the multiple gap does not. Four of 482 IRs ask $100 or more. Forty-two of 222 SIRs do. But 65.26% of the 475 IRs we can price in a PSA 10 carry a median of $100 or more, against 61.01% of the 218 SIRs. Buying one raw and buying one graded are two different questions with two different answers.
What an IR is, and what an SIR is
Both sit past the end of the set. Every one of the 704 cards in this study is numbered above its set's printed total, so a card reading 203/193 out of a 193-card set is the first sign you are holding one. It is a sign and not proof: other treatments are numbered past the total too.
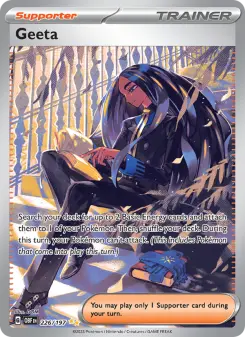
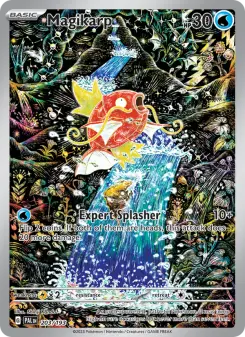
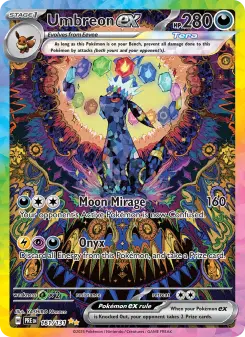
The difference is what is drawn. An Illustration Rare is an ordinary Pokemon given a full-art scene. A Special Illustration Rare is the same treatment applied to a set's headline card: 157 of the 222 SIRs carry "ex" as a word in the name and the other 65 are trainers, cards like Geeta, Iono and Team Rocket's Giovanni. Not one of the 482 IRs is either. So an Illustration Rare is a card like Magikarp, an ordinary Pokemon given a scene, and a Special Illustration Rare is a card like Umbreon ex, the set's headline ex in the same treatment. A typical set prints more of the first kind: across the 22 sets here the median set holds 18.5 IRs and 7.5 SIRs.
Both are sold in a single finish. All 704 carry exactly one priced printing on September 28, and it is Holofoil in all 704 cases, so there is no reverse-holo or non-holo version of either to confuse with the card you are holding, which also keeps both tiers out of the finish comparison in Are Reverse Holo Pokémon Cards Worth More?. That is unusual: How Many Printings Does a Pokemon Card Have finds most English cards are sold in two or more. And neither is the top printed rung. The rarity chart puts gold Secret and Hyper Rares above both on the printed ladder and finds them selling for less.
What each one asks, raw
These are asks: the daily TCGplayer market price for the card's one printing, never a completed sale. Every one of the 704 cards carries one on the day. The Illustration Rare distribution is narrow and it has a floor: the cheapest of the 482 asks $1.01, the 90th percentile is $41.83, and only four clear $100. The SIR distribution is wider through its middle half and reaches far higher, from $3.19 up to $1,384.05, though even its cheapest card is dearer than the IR's.
Ask distribution by tier, 704 English cards, 2026-09-28
| Tier | Cards | 25th | Median | 75th | 90th | Highest ask | Under $5 | $100 or more |
|---|---|---|---|---|---|---|---|---|
| Illustration Rare | 482 | $6.01 | $11.99 | $22.65 | $41.83 | $368.75 | 19.92% | 0.83% (4) |
| Special Illustration Rare | 222 | $19.13 | $34.28 | $71.06 | $189.37 | $1,384.05 | 2.25% | 18.92% (42) |
This agrees with what we published five days ago. The rarity chart read the IR median at $12.25 and the SIR at $35.21 on September 23, across 499 and 229 priced cards. Subtract the 17 IRs and 7 SIRs from 30th Celebration, which this study excludes because the set released on September 16 and its prices are still unwinding from preorder, and 499 and 229 become exactly 482 and 222. Same measurement, one universe smaller, five days later.
What share of them clear $100
There are two honest answers here, depending on which number you mean. As a raw card, almost no Illustration Rare is a $100 card: four of 482, which is 0.83%. Nearly a fifth of SIRs are: 42 of 222. Graded, both tiers clear $100 more often than not, and the IR clears it slightly more often than the SIR does.
Share clearing $100, raw against graded
Higher up it goes the other way. Of those same 475 IRs, 6.53% carry a PSA 10 median at or above $500 and 0.63% at or above $1,000, against 11.47% and 4.13% of the 218 SIRs. The SIR owns the top of the range. The IR owns the middle of it, which is where most of the cards are.
Graded, the IR carries the premium
Coverage here is close to complete, which is what makes the comparison worth making at all: 475 of 482 IRs and 218 of 222 SIRs carry a PSA 10 median resting on three or more verified sales, and every median used here was written on or after September 25, 2026. The middle IR rests on 63 recorded sales, the middle SIR on about 130.
PSA 10 sold medians by the sales each one rests on
| Verified sales required | IR cards | IR PSA 10 median | IR against its own ask | SIR cards | SIR PSA 10 median | SIR against its own ask |
|---|---|---|---|---|---|---|
| 3 or more | 475 | $152.50 | 12.24x | 218 | $115.80 | 3.40x |
| 10 or more | 441 | $146.00 | 11.81x | 216 | $116.74 | 3.39x |
| 20 or more | 376 | $120.13 | 10.91x | 207 | $119.99 | 3.31x |
Read that table carefully, because one half of it is fragile. The level gap closes as the bar rises: at 20 or more recorded sales the two medians are $120.13 and $119.99, which is no gap at all. Raise the bar and you keep the cards that trade often, and the cards that trade often are more evenly matched. So we would not stand behind "the IR sells for more graded" as a general claim.
The multiple does not close. It sits between 10.9x and 12.2x for the IR at every bar and between 3.3x and 3.4x for the SIR. And 12x is not remarkable: How Much a PSA 10 Adds measured the middle card of 8,676 at 12.2x on September 22, at a two-sale bar rather than the three used here. The Illustration Rare is an ordinary card in that respect. The Special Illustration Rare is the odd one, at roughly a quarter of the usual premium, and the reason is visible in the raw prices above. You pay for an SIR before it is graded. On an IR, most of what a PSA 10 is worth has not been paid yet. If you want the gap between a listing price and a sale price on its own terms, Ask Versus Sold is the study of it.
Does the SIR premium hold as a set ages?
No, and the pattern is steep. Take the 19 sets that hold at least five IRs and five SIRs with a price, and compute each set's median SIR ask against its median IR ask. In the three sets released in 2026 the middle reading is 13.07x. In the five released in 2023 it is 0.91x, meaning the median SIR in a 2023 set asks slightly less than the median IR from the same pack. Across all 19, the rank correlation between how recently a set released and how big its SIR premium is comes to 0.85.
Median SIR ask against median IR ask, by the year the set released
Say plainly what this is and is not. It is 19 sets of different ages measured on one day, not one set followed for three years. The daily ask series behind this study reaches back 29 days, so we cannot walk a 2023 set back to its release and watch it happen. What we can say is that two separate measurements point the same way: SIR Versus IR tracked 403 cards from the point their prices settled and found the SIRs returning a median of minus 7% while the Illustration Rares returned plus 76%, and the art floor study put IRs at plus 77.4% against SIRs at plus 29.5% over its window. One cross-section, one series through time, agreeing on direction. We are not claiming a cause. Print runs, how many of each tier a set contains, and which characters got the treatment all changed over these three years, and none of that is separated here.
Every set holding 5 or more priced cards in both tiers, ordered by SIR premium
| Set | Released | IR median ask | SIR median ask | SIR over IR, asks | IR PSA 10 median (cards) | SIR PSA 10 median (cards) | SIR over IR, PSA 10 |
|---|---|---|---|---|---|---|---|
| Perfect Order | 2026-03 | $2.04 | $42.74 | 20.95x | $49.50 (11) | $121.94 (6) | 2.46x |
| Mega Evolution | 2025-09 | $3.75 | $54.91 | 14.66x | $44.62 (22) | $126.38 (10) | 2.83x |
| Ascended Heroes | 2026-01 | $4.80 | $62.74 | 13.07x | $48.84 (33) | $155.70 (22) | 3.19x |
| Chaos Rising | 2026-05 | $2.54 | $28.03 | 11.03x | $78.00 (11) | $110.75 (6) | 1.42x |
| Destined Rivals | 2025-05 | $6.64 | $59.96 | 9.03x | $99.12 (23) | $142.50 (11) | 1.44x |
| Journey Together | 2025-03 | $4.75 | $39.23 | 8.26x | $79.99 (11) | $129.75 (6) | 1.62x |
| Twilight Masquerade | 2024-05 | $8.32 | $34.20 | 4.11x | $90.71 (21) | $115.00 (11) | 1.27x |
| Phantasmal Flames | 2025-11 | $4.04 | $16.26 | 4.02x | $60.50 (13) | $70.00 (5) | 1.16x |
| Surging Sparks | 2024-11 | $8.31 | $28.71 | 3.45x | $100.00 (23) | $102.75 (11) | 1.03x |
| Stellar Crown | 2024-09 | $8.25 | $26.63 | 3.23x | $75.00 (13) | $76.68 (6) | 1.02x |
| Black Bolt | 2025-07 | $16.39 | $45.56 | 2.78x | $288.20 (68) | $97.97 (7) | 0.34x |
| White Flare | 2025-07 | $16.97 | $44.68 | 2.63x | $267.00 (69) | $97.00 (7) | 0.36x |
| Temporal Forces | 2024-03 | $19.32 | $36.94 | 1.91x | $153.13 (22) | $122.93 (10) | 0.80x |
| 151 | 2023-09 | $44.18 | $83.70 | 1.89x | $297.24 (16) | $386.00 (7) | 1.30x |
| Paradox Rift | 2023-11 | $14.16 | $15.45 | 1.09x | $117.54 (34) | $103.75 (15) | 0.88x |
| Shrouded Fable | 2024-08 | $26.82 | $25.50 | 0.95x | $169.99 (15) | $99.00 (5) | 0.58x |
| Paldea Evolved | 2023-06 | $19.37 | $17.62 | 0.91x | $231.00 (36) | $97.50 (15) | 0.42x |
| Scarlet & Violet | 2023-03 | $13.33 | $10.53 | 0.79x | $232.98 (19) | $95.50 (10) | 0.41x |
| Obsidian Flames | 2023-08 | $12.47 | $5.55 | 0.44x | $231.75 (12) | $97.10 (6) | 0.42x |
The graded columns tell the same story with more noise, and the noise is worth naming. The IR's PSA 10 median is above the SIR's in 8 of these 19 sets, six of them released in 2023 or 2024; the other two are Black Bolt and White Flare. Raising the sales bar from 3 to 8 or to 20 leaves the count at 8 of 19, the same eight sets each time, so this is not an artifact of thin comps.
Two rows sit against the age pattern, and both differ structurally from the rest. 151 released in September 2023 and its SIRs still hold a premium on both instruments, 1.89x on asks and 1.30x on PSA 10 medians. Black Bolt and White Flare print 69 and 70 Illustration Rares each, against a median of 22 across the nineteen sets in that table, and their IRs carry PSA 10 medians of $288.20 and $267.00 against SIR medians of $97.97 and $97.00. We are recording that, not explaining it.
The top of each list on September 28, and the widest gap between a listing and a sale
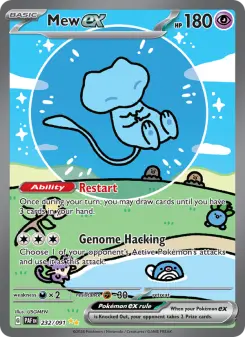
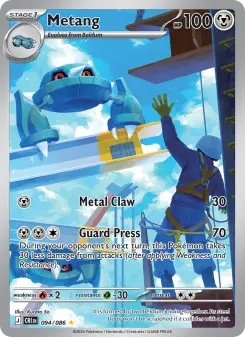
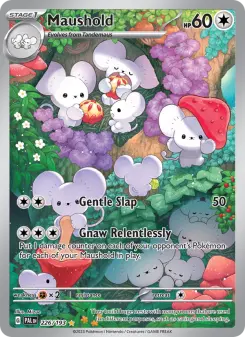
What a buyer does with this depends on which end of the trade they are on. If you are opening packs, the Special Illustration Rare is where the money is in a new set, and its lead over the Illustration Rare is smaller in older sets. If you are buying to grade, the Illustration Rare is the tier where the slab is doing the work, at a premium close to the corpus median rather than the quarter-premium the SIR carries. And before trusting any single graded figure, check what it rests on: How Many Sales Is a Price explains why a median on three sales and a median on 592 are not the same kind of number, and The Most Expensive PSA 10 Pokémon Cards shows what happens to a ranking at the top of the market when that bar is enforced.
What would overturn this
The age gradient is the claim with the most riding on it, and it is the one most easily broken. It is a cross-section: 19 sets of different ages read on one day, with a rank correlation of 0.85 between release date and the SIR premium. Rerun the same 19 sets in three months. If the whole ladder shifts down together, with the 2023 cohort holding near 0.91x while the 2026 cohort falls toward it, the gradient is set age and the reading stands. If every cohort falls by a similar amount, what this measures is a market-wide slide and not ageing at all. And if the 2026 cohort holds above 10x for a year, the unwinding is slower than a cross-section can see and the figure should be quoted as a snapshot rather than a curve. The second test is the graded half: the level gap between the two tiers already vanishes at a 20-sale bar, so run the per-card multiple again once the thin cards have comps. If the IR premium falls toward the SIR's 3.4x as coverage deepens, the durable finding is the ask ladder and not the multiple.
UNIVERSE. English rows in `cards` carrying a non-empty TCGplayer product id, collapsed to one row per product id, whose `rarity` field lowercases to "illustration rare" or "special illustration rare". That field carries two spellings, "Illustration rare" on 496 rows and "Illustration Rare" on 4, so matching case-sensitively drops four cards; all four of those are 30th Celebration and fall outside this study anyway. 732 rows resolve to 728 products, 4 rows carrying no product id. No two of the 728 share a product id, so the catalog-duplicate collapse that costs about 3% elsewhere costs nothing here. EXCLUSIONS: the 24 products from 30th Celebration (17 IR, 7 SIR), because the set released 2026-09-16, its prices are still moving off preorder, and not one of the 24 carries a graded sale. That leaves 482 Illustration Rares and 222 Special Illustration Rares across 22 sets. Japanese rows are out of scope throughout. TRAINER AND EX CLASSIFICATION is by name against `cards.name`, because `cards` carries no card-type column: 157 of the 222 SIRs carry "ex" as a word in the name, and the remaining 65 names were read by hand and are all trainers. DAY: 20724, which is 2026-09-28, pinned rather than taken as the newest day, because it is the most recent day on which the ask, the per-printing and the graded sources are all complete. ASKS: `price_history` day 20724, the TCGplayer market price for the flagship printing, which is a listing price and never a sale. All 704 products carry one. FINISHES: `tcgcsv_prices` day 20724, which returns exactly one priced printing for each of the 704, Holofoil in every case. GRADED: `graded_snapshots`, PSA 10 rows only, the latest row per key on or before day 20724, read across both keyspaces the table uses (numeric product id and catalog id) with the fresher row winning and ties going to the product-id row. 30 of the 693 covered cards carry rows in both keyspaces and 4 resolve to the catalog-id row; same-day rows in the two keyspaces can disagree sharply, so under the opposite tie-break the two headline multiples read 12.18x and 3.43x while every count, pooled median and share above is unchanged. A card page has no tie-break of its own and may show a reader the other figure. The writing cron withholds a quoted-grade row for four separate reasons, so "no median" means our writer published no PSA 10 row for that card and never a value of zero: fewer than three verified sales, a median above sixty times the raw ask on the day it was written, a median below three tenths of it, or a card the budgeted queue did not reach. 7 IRs and 4 SIRs are in that position and appear in no figure here; seven of the eleven carry a PSA 9 row, so for those the feed answered and withheld only the ten. 475 IRs and 218 SIRs carry a median at 3 or more sales, 441 and 216 at 10 or more, 376 and 207 at 20 or more. Every median used was written within three days of the pinned day. That sixty-times rule is a censoring rule and it shapes the top of this study: the largest PSA 10 multiple among the 693 covered cards is 59.8x and not one reaches 60x, so the widest gaps quoted here are read off the rows that survived the filter rather than off an uncensored population. Across the whole catalogue that ceiling is not absolute, because an ask can fall after a row is written, but on these cards the asks have not drifted enough for that. The join was checked rather than assumed: the card name in `cards` agrees with the name on the graded row for 693 of 693 matches. SET COMPARISON: a set enters when it holds 5 or more priced products in each tier, which admits 19 of the 22 and drops Prismatic Evolutions and ME05: Pitch Black (no IRs) and Paldean Fates (3 IRs). Release dates are the provider publication dates in `tcgcsv_groups`, matched by the same leading-prefix rule the set pages use, plus two explicit overrides the prefix rule cannot reach: "SV01: Scarlet & Violet Base Set" to Scarlet & Violet and "SV: Scarlet & Violet 151" to 151. Without those two, Scarlet & Violet and 151 resolve to nothing and the 2023 cohort loses two of its five sets. A third mapping, "ME: 30th Celebration Classic Collection" to 30th Celebration, is applied for completeness and changes nothing, because the set is excluded and its main provider group already matches the prefix rule at the same date. Per-set graded medians are taken at 3 or more sales and the card count is printed beside each; the 8-of-19 count and all four yearly readings are unchanged at 8 or more and at 20 or more. The yearly figures are medians of per-set ratios, not pooled ratios. MEDIAN CONVENTION, stated because two studies quoted above use the other one: an even-sample median here is the mean of the two middle values, where `pokemon-card-rarity-chart-by-value` and `psa-10-premium-distribution` take the upper-middle value. It moves two figures in this article and nothing else. On the upper-middle convention the SIR median ask is $34.35 rather than $34.28 and the SIR PSA 10 median at three or more sales is $116.47 rather than $115.80; the IR ask median, both headline multiples and the 2.86x step are identical either way, because those samples are odd. The rank correlation of 0.85 is Spearman between release date and the per-set SIR-over-IR ask ratio across the 19 sets. This is a cross-section of sets of different ages on one day, not a series following any set through time. FIGURES FROM OTHER STUDIES are attributed and dated where they appear and were not recomputed here.